

DESIGN AND USABILITY
Updated icons
In Ranet HTML Pivot Table 5.7.225 we have updated the design of our icons for a more modern look. At the same time they were redrawn in SVG to keep the image sharp on high resolution displays.

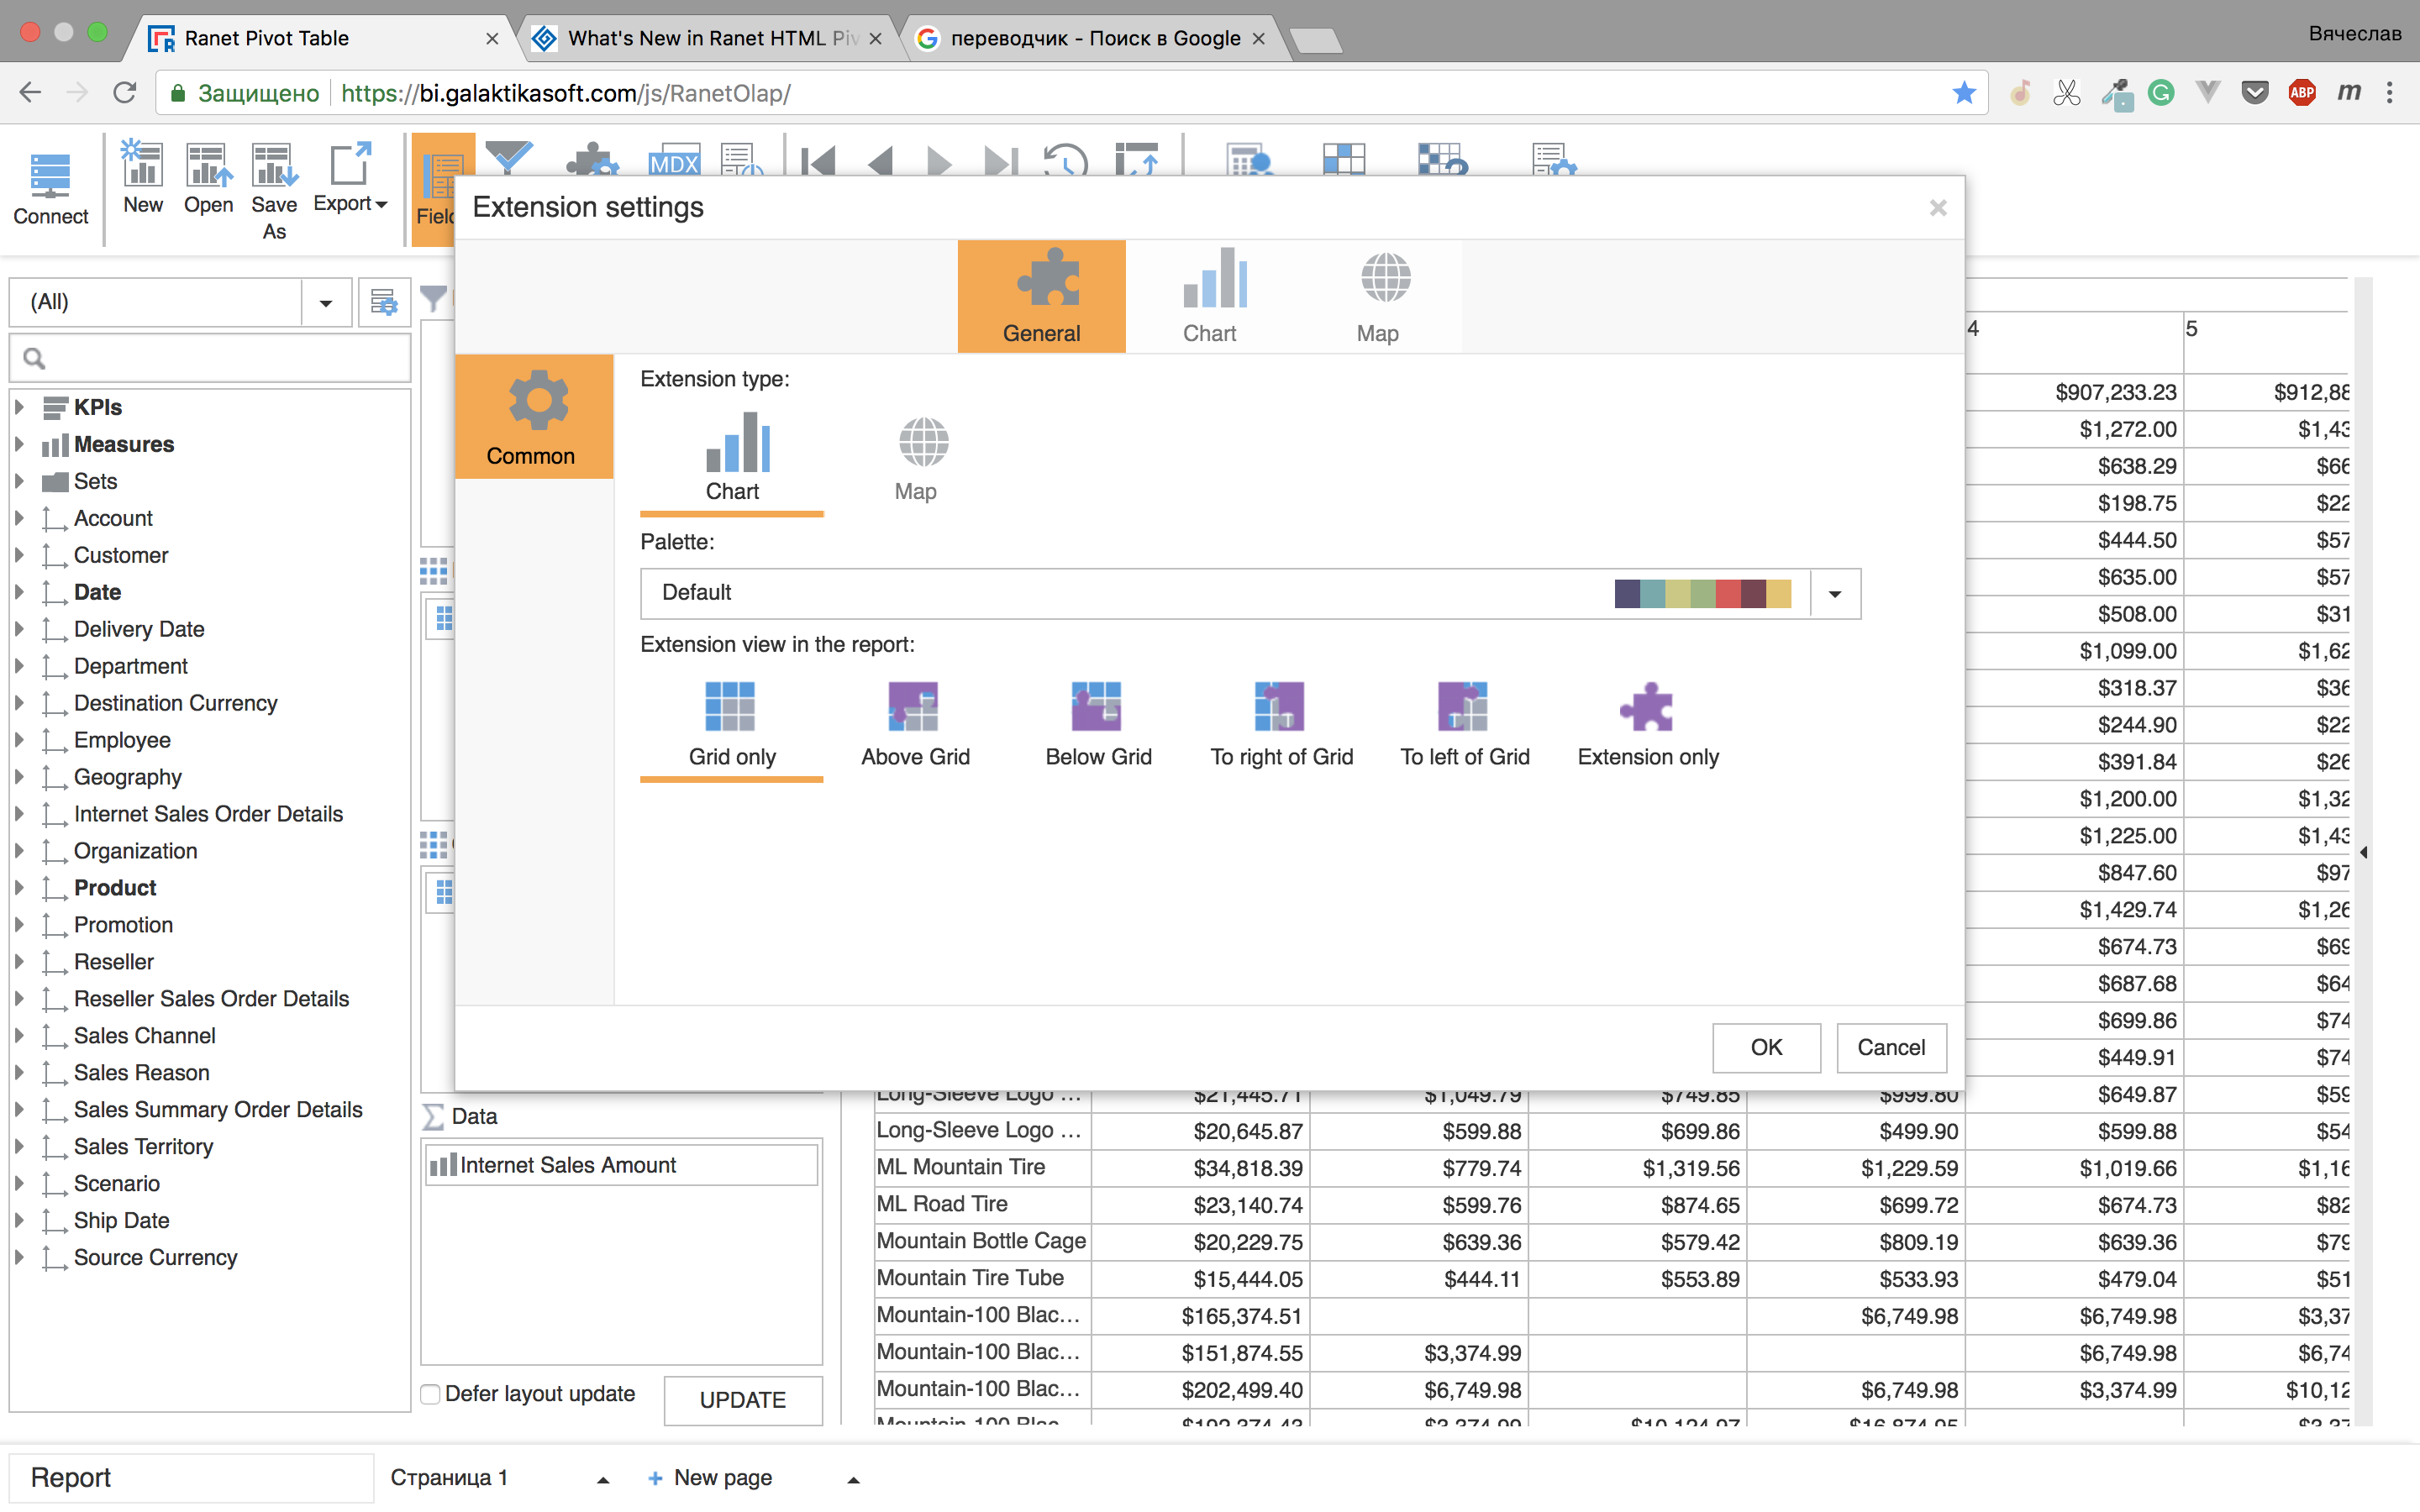
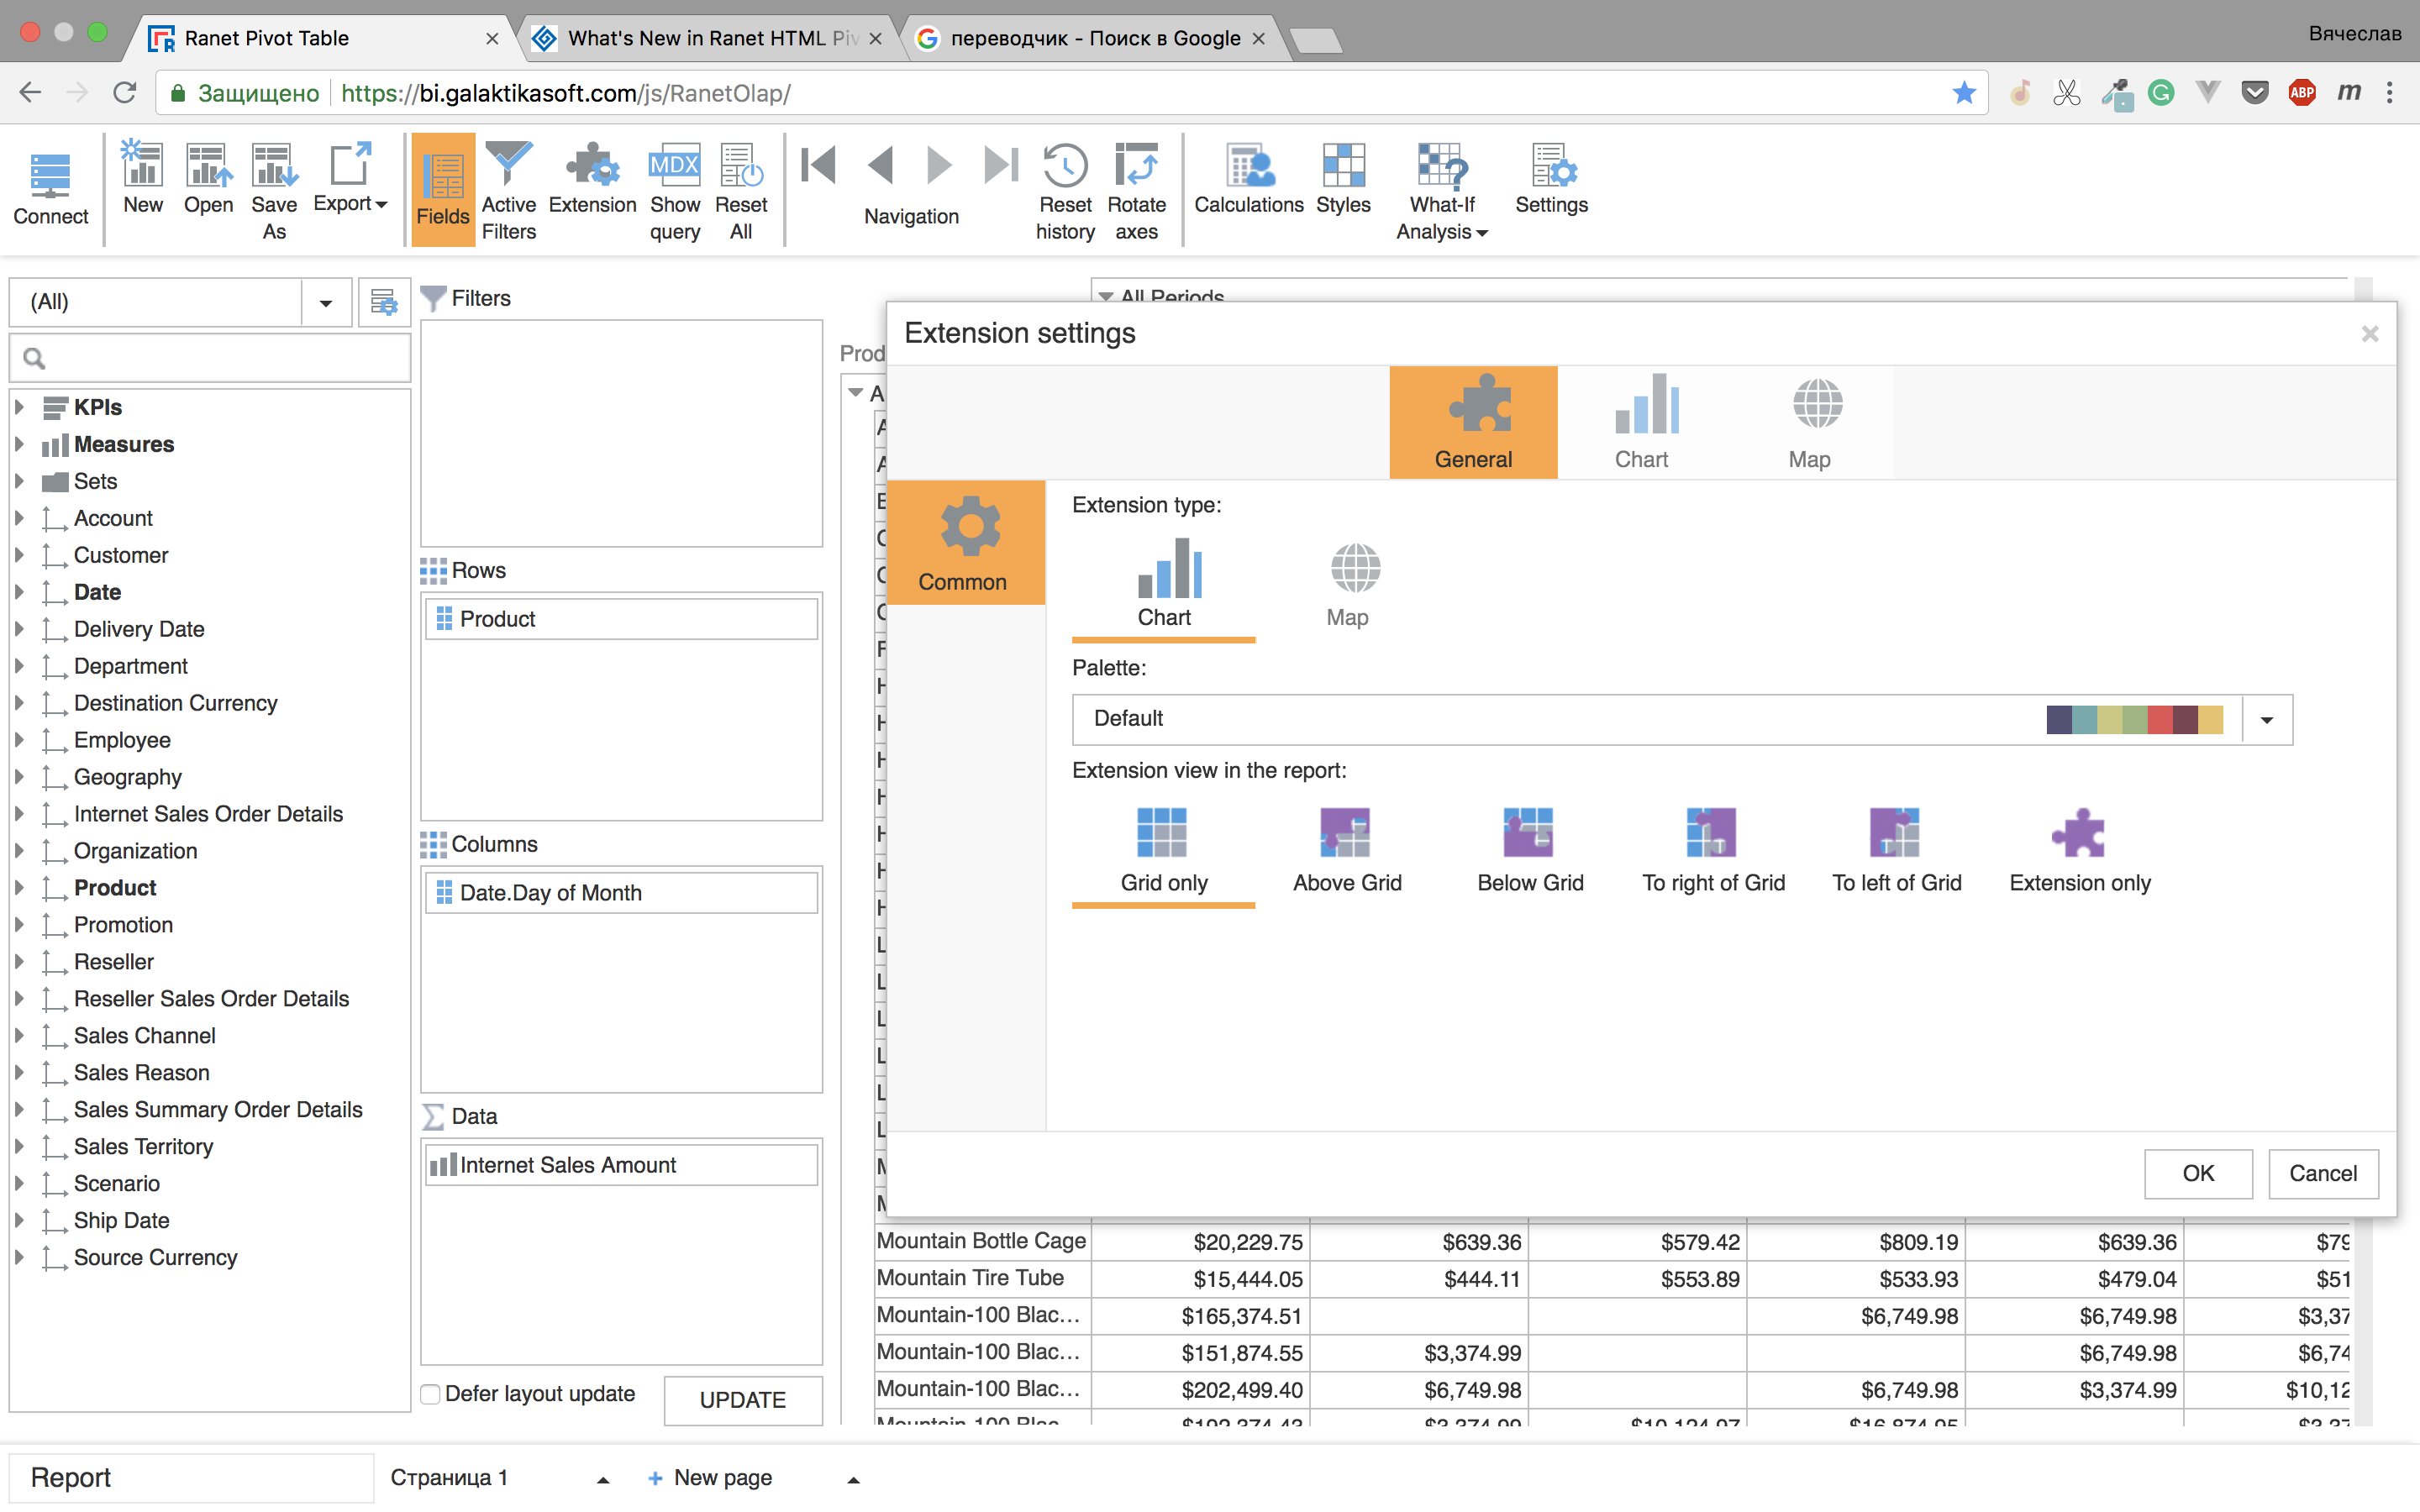
Drag for modal windows
Modal windows are no longer static. You can drag them around if they are blocking the necessary area. However, all the page behind the modal are still blocked for any interactions.
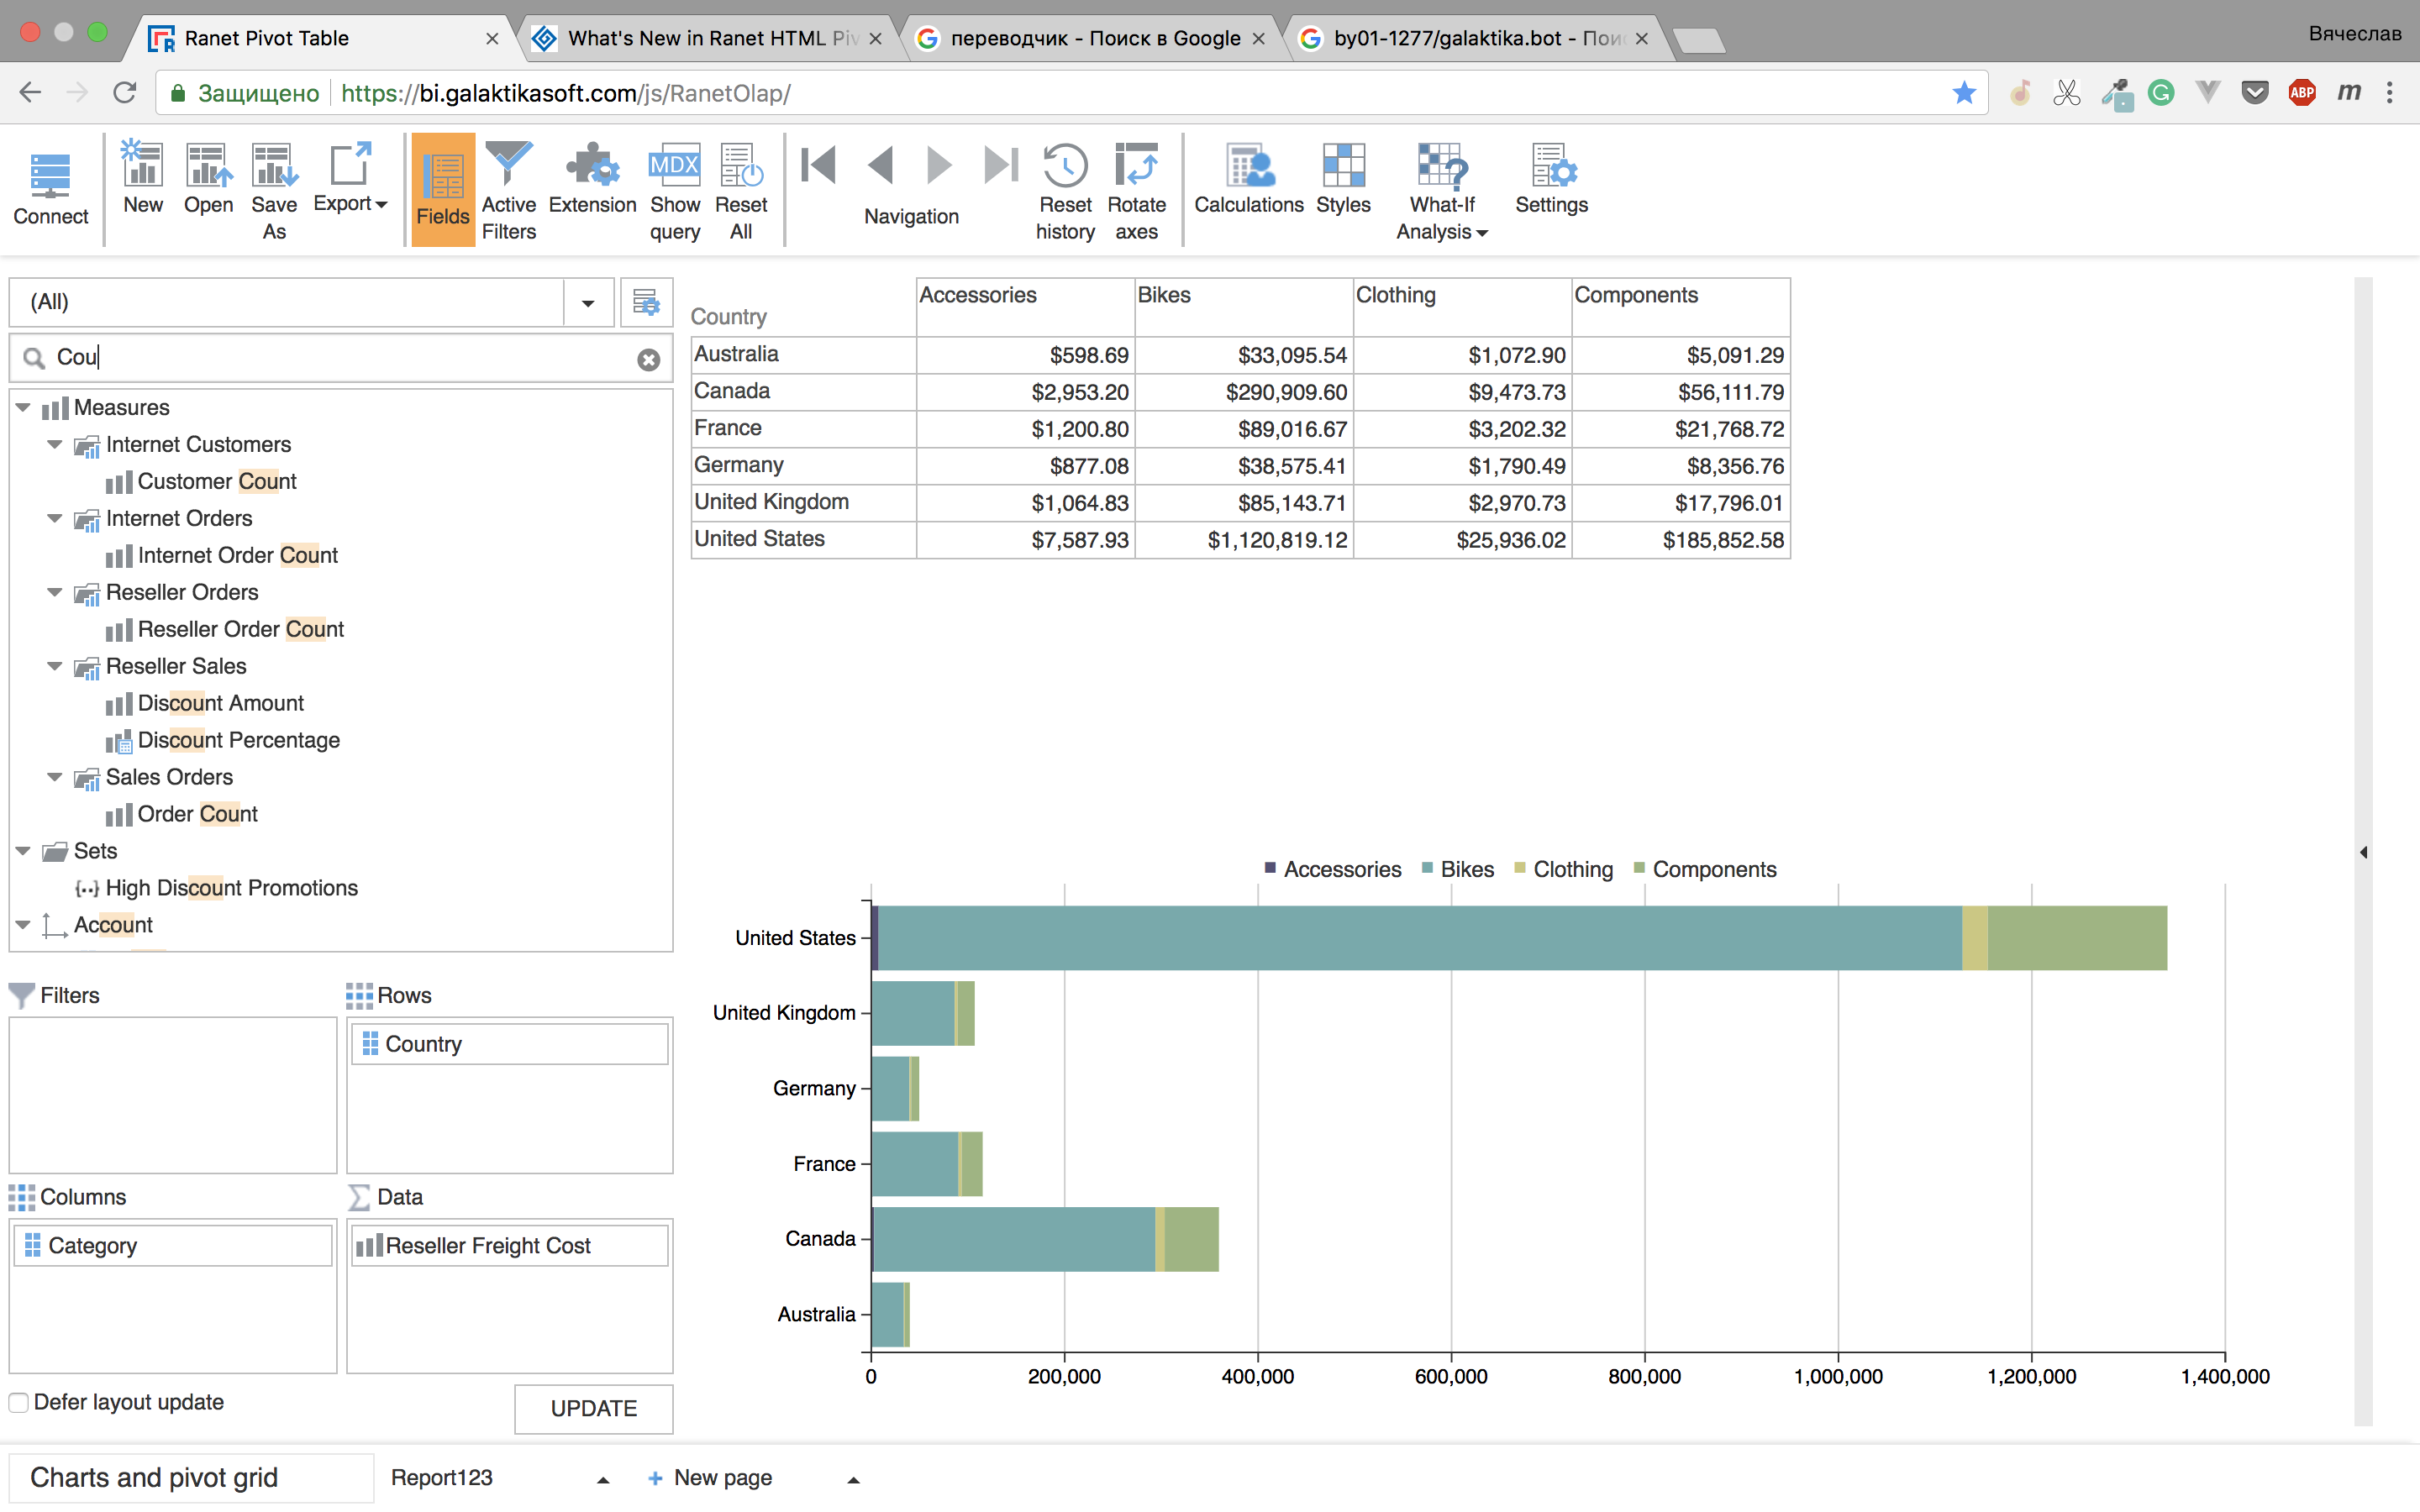
Search in tree views and lists
You can now use the search area to find necessary elements faster.
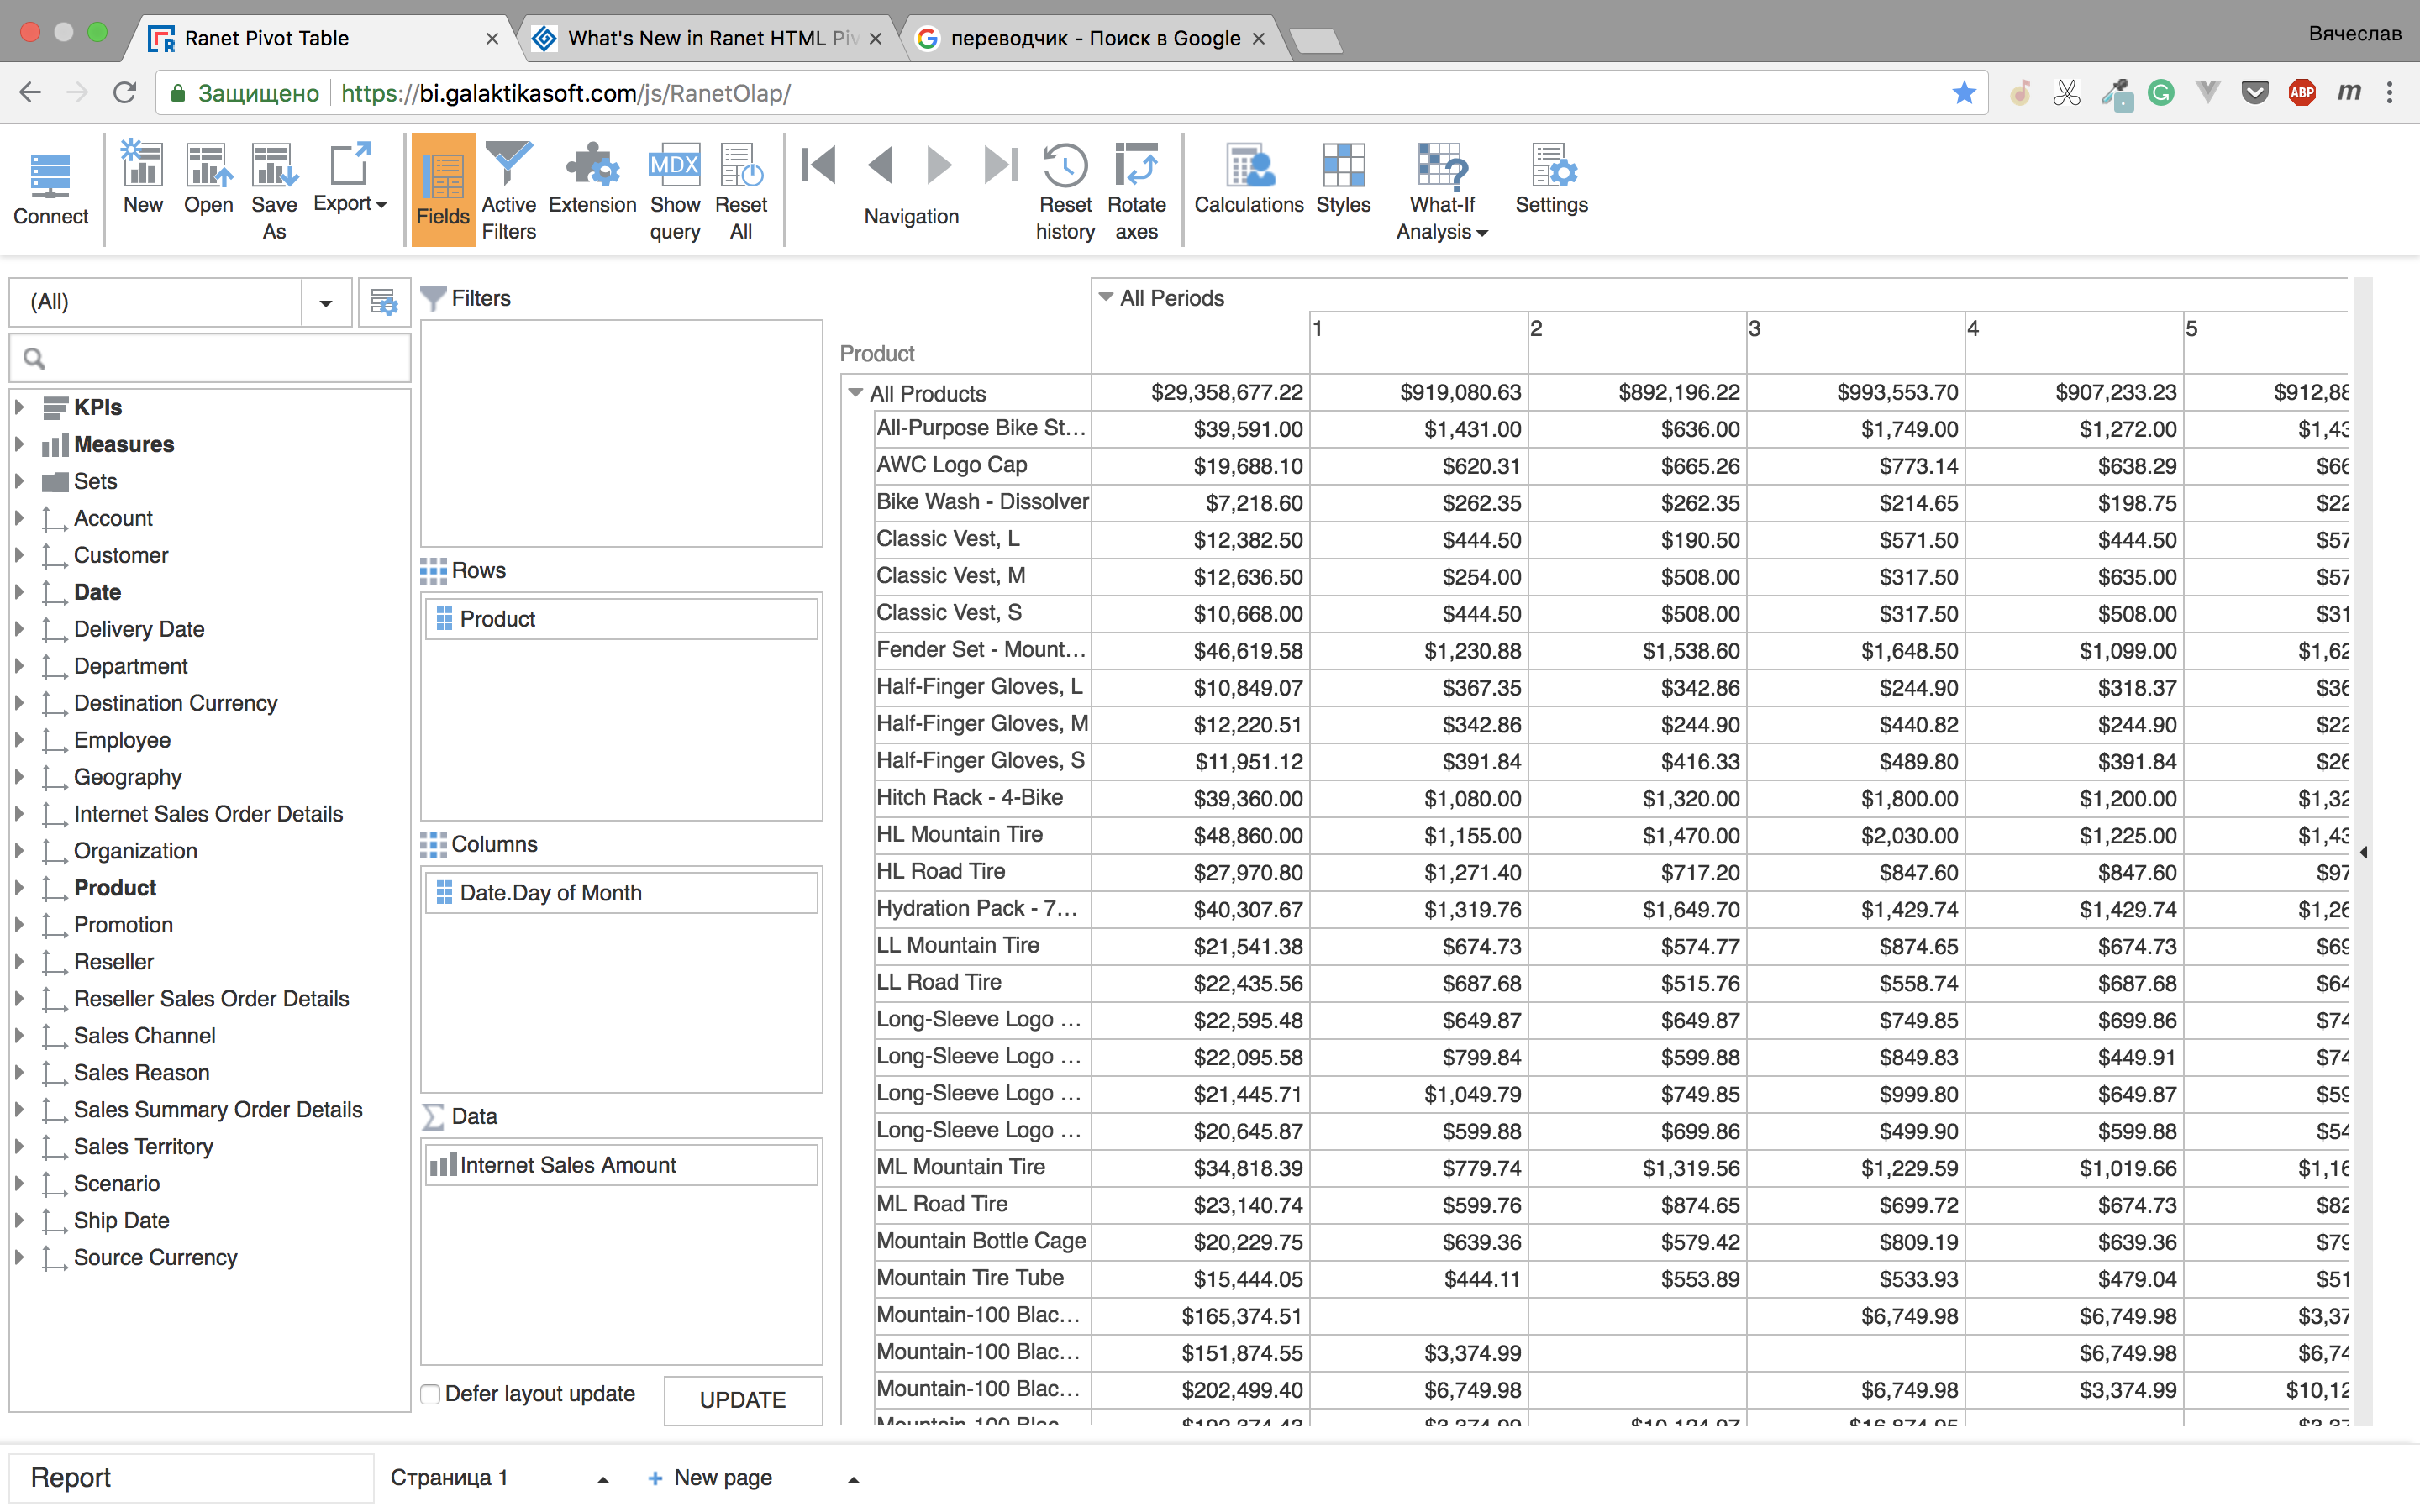
Pivot Table
Adding items to Pivot Table by double click
Now you can use a double click in Cube Explorer to add an item to Query Designer instead of dragging it. By default all the elements describing the dates will be added to rows and all other to columns. Meaures will be added to Values area.
Additional Visual Calculations
In this version you have an ability to display the values in Pivot Table relative to parent on the root element of the axis.
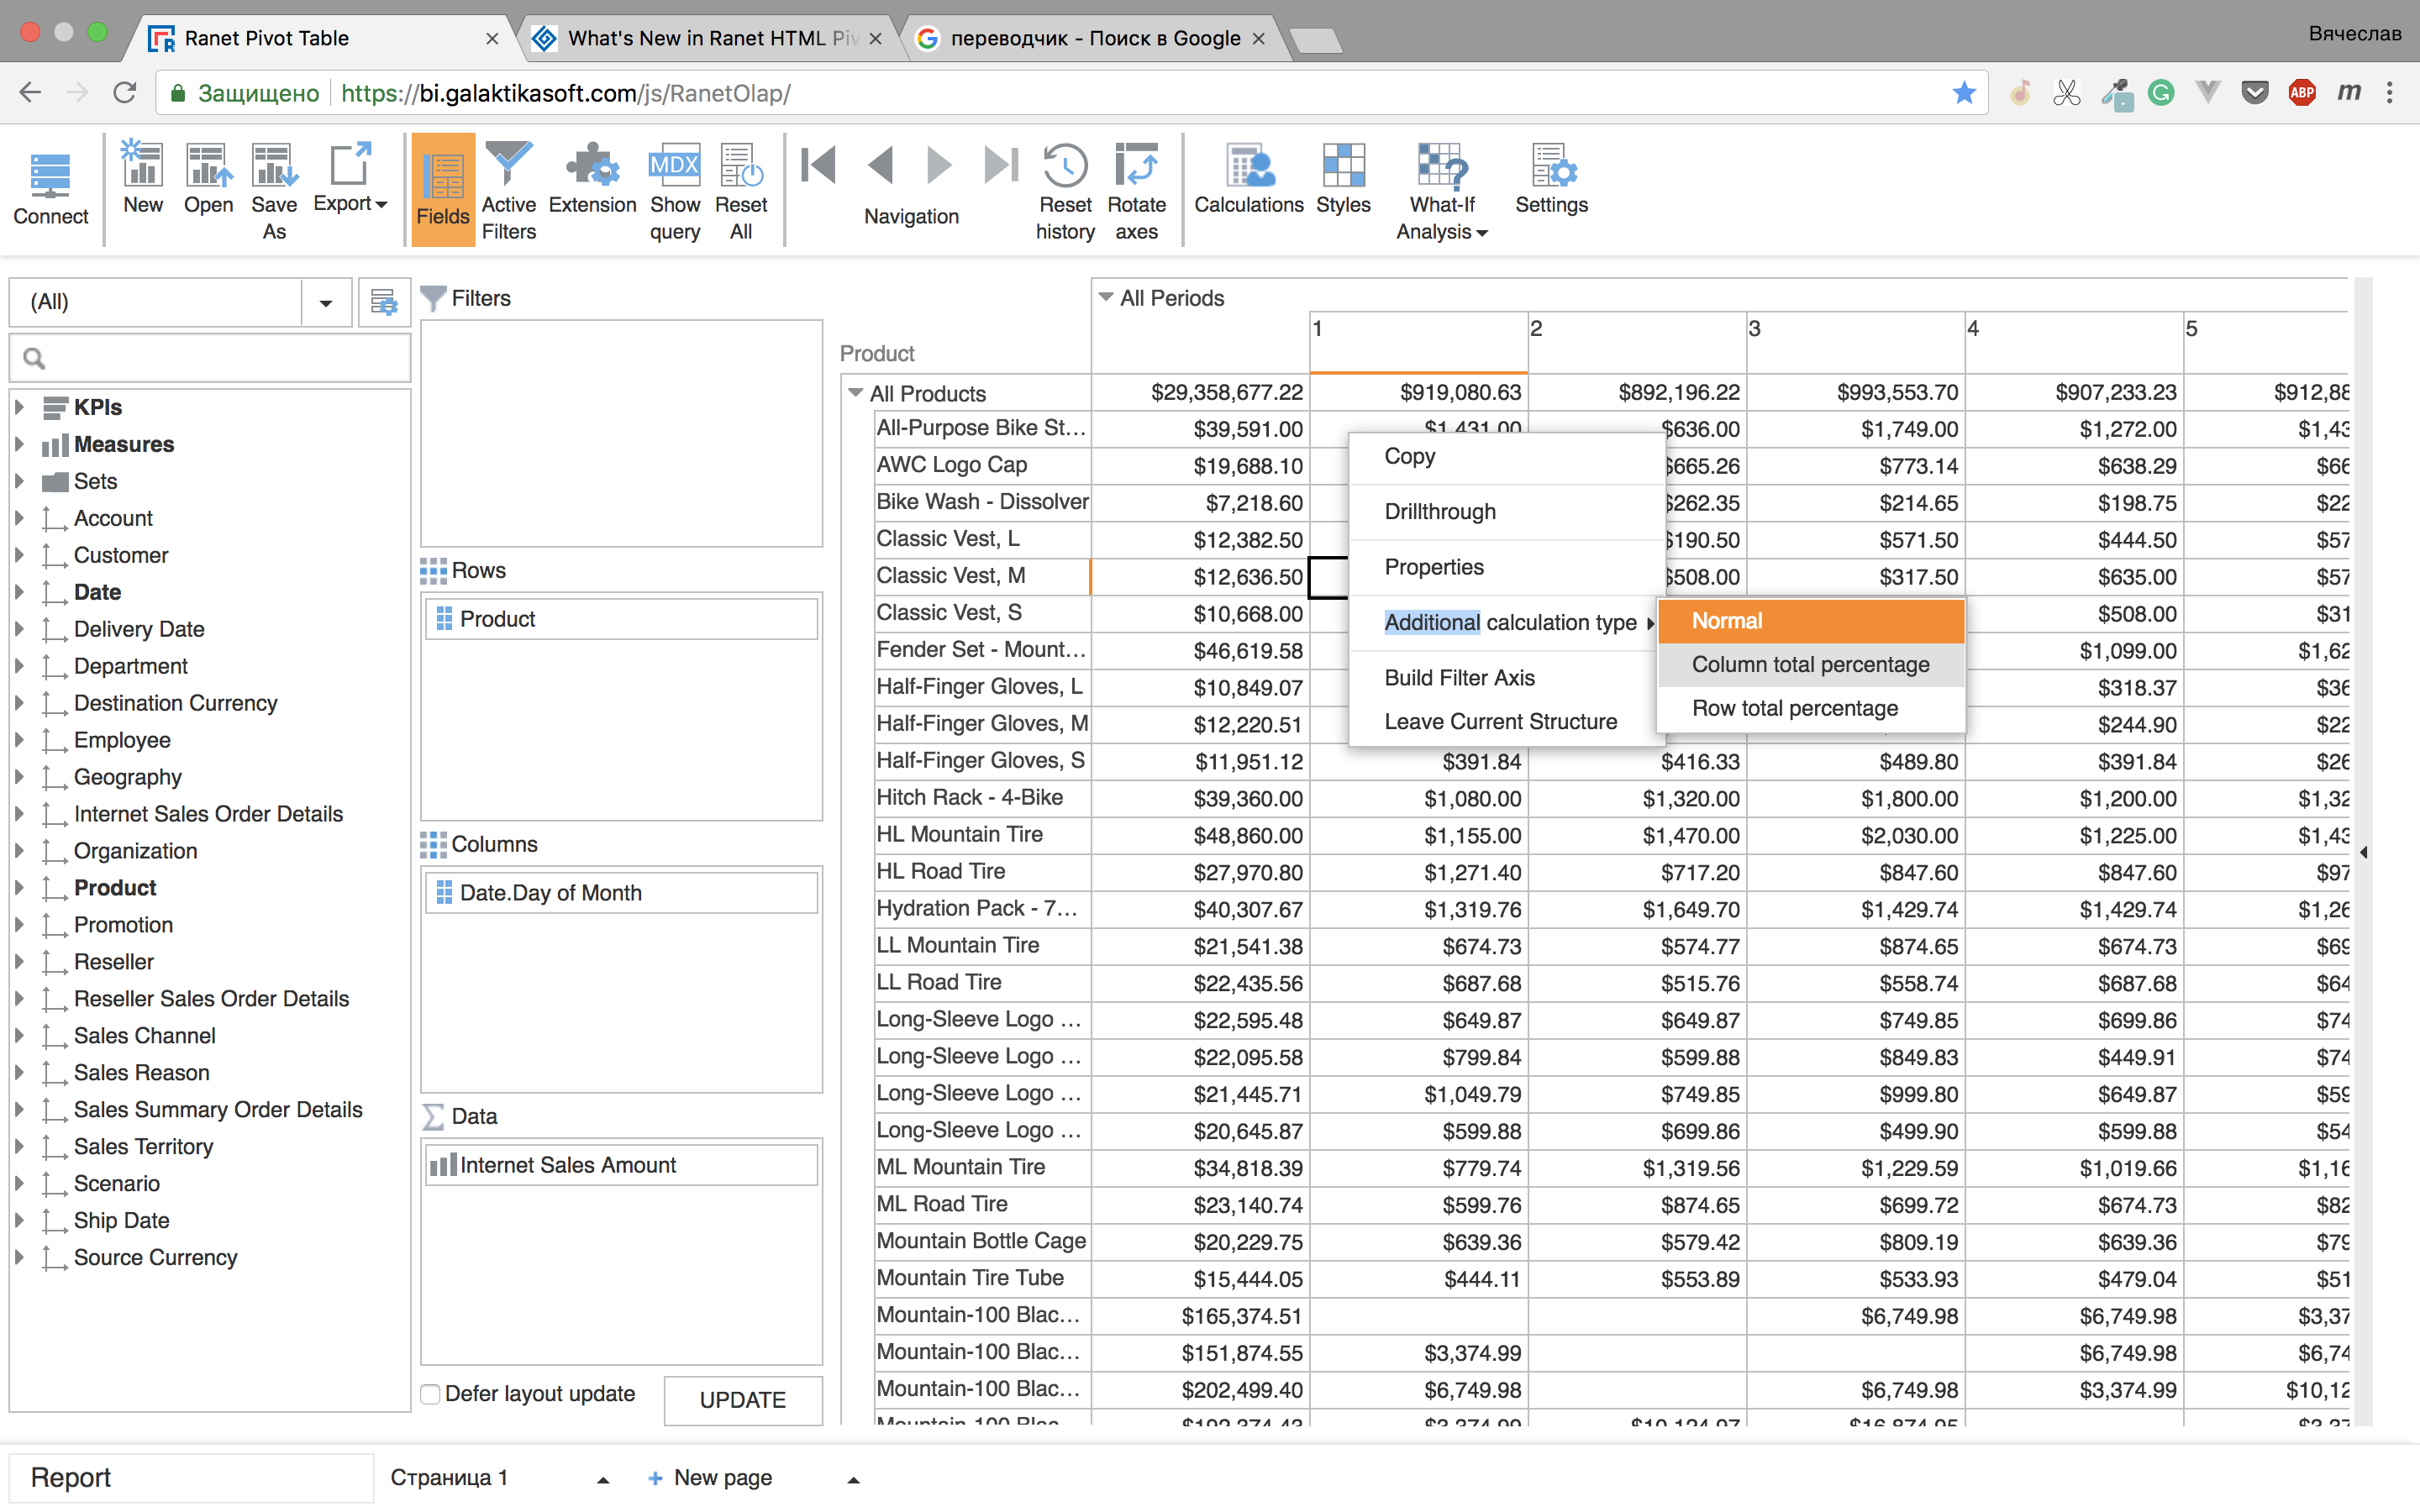
We provide 2 possible options:
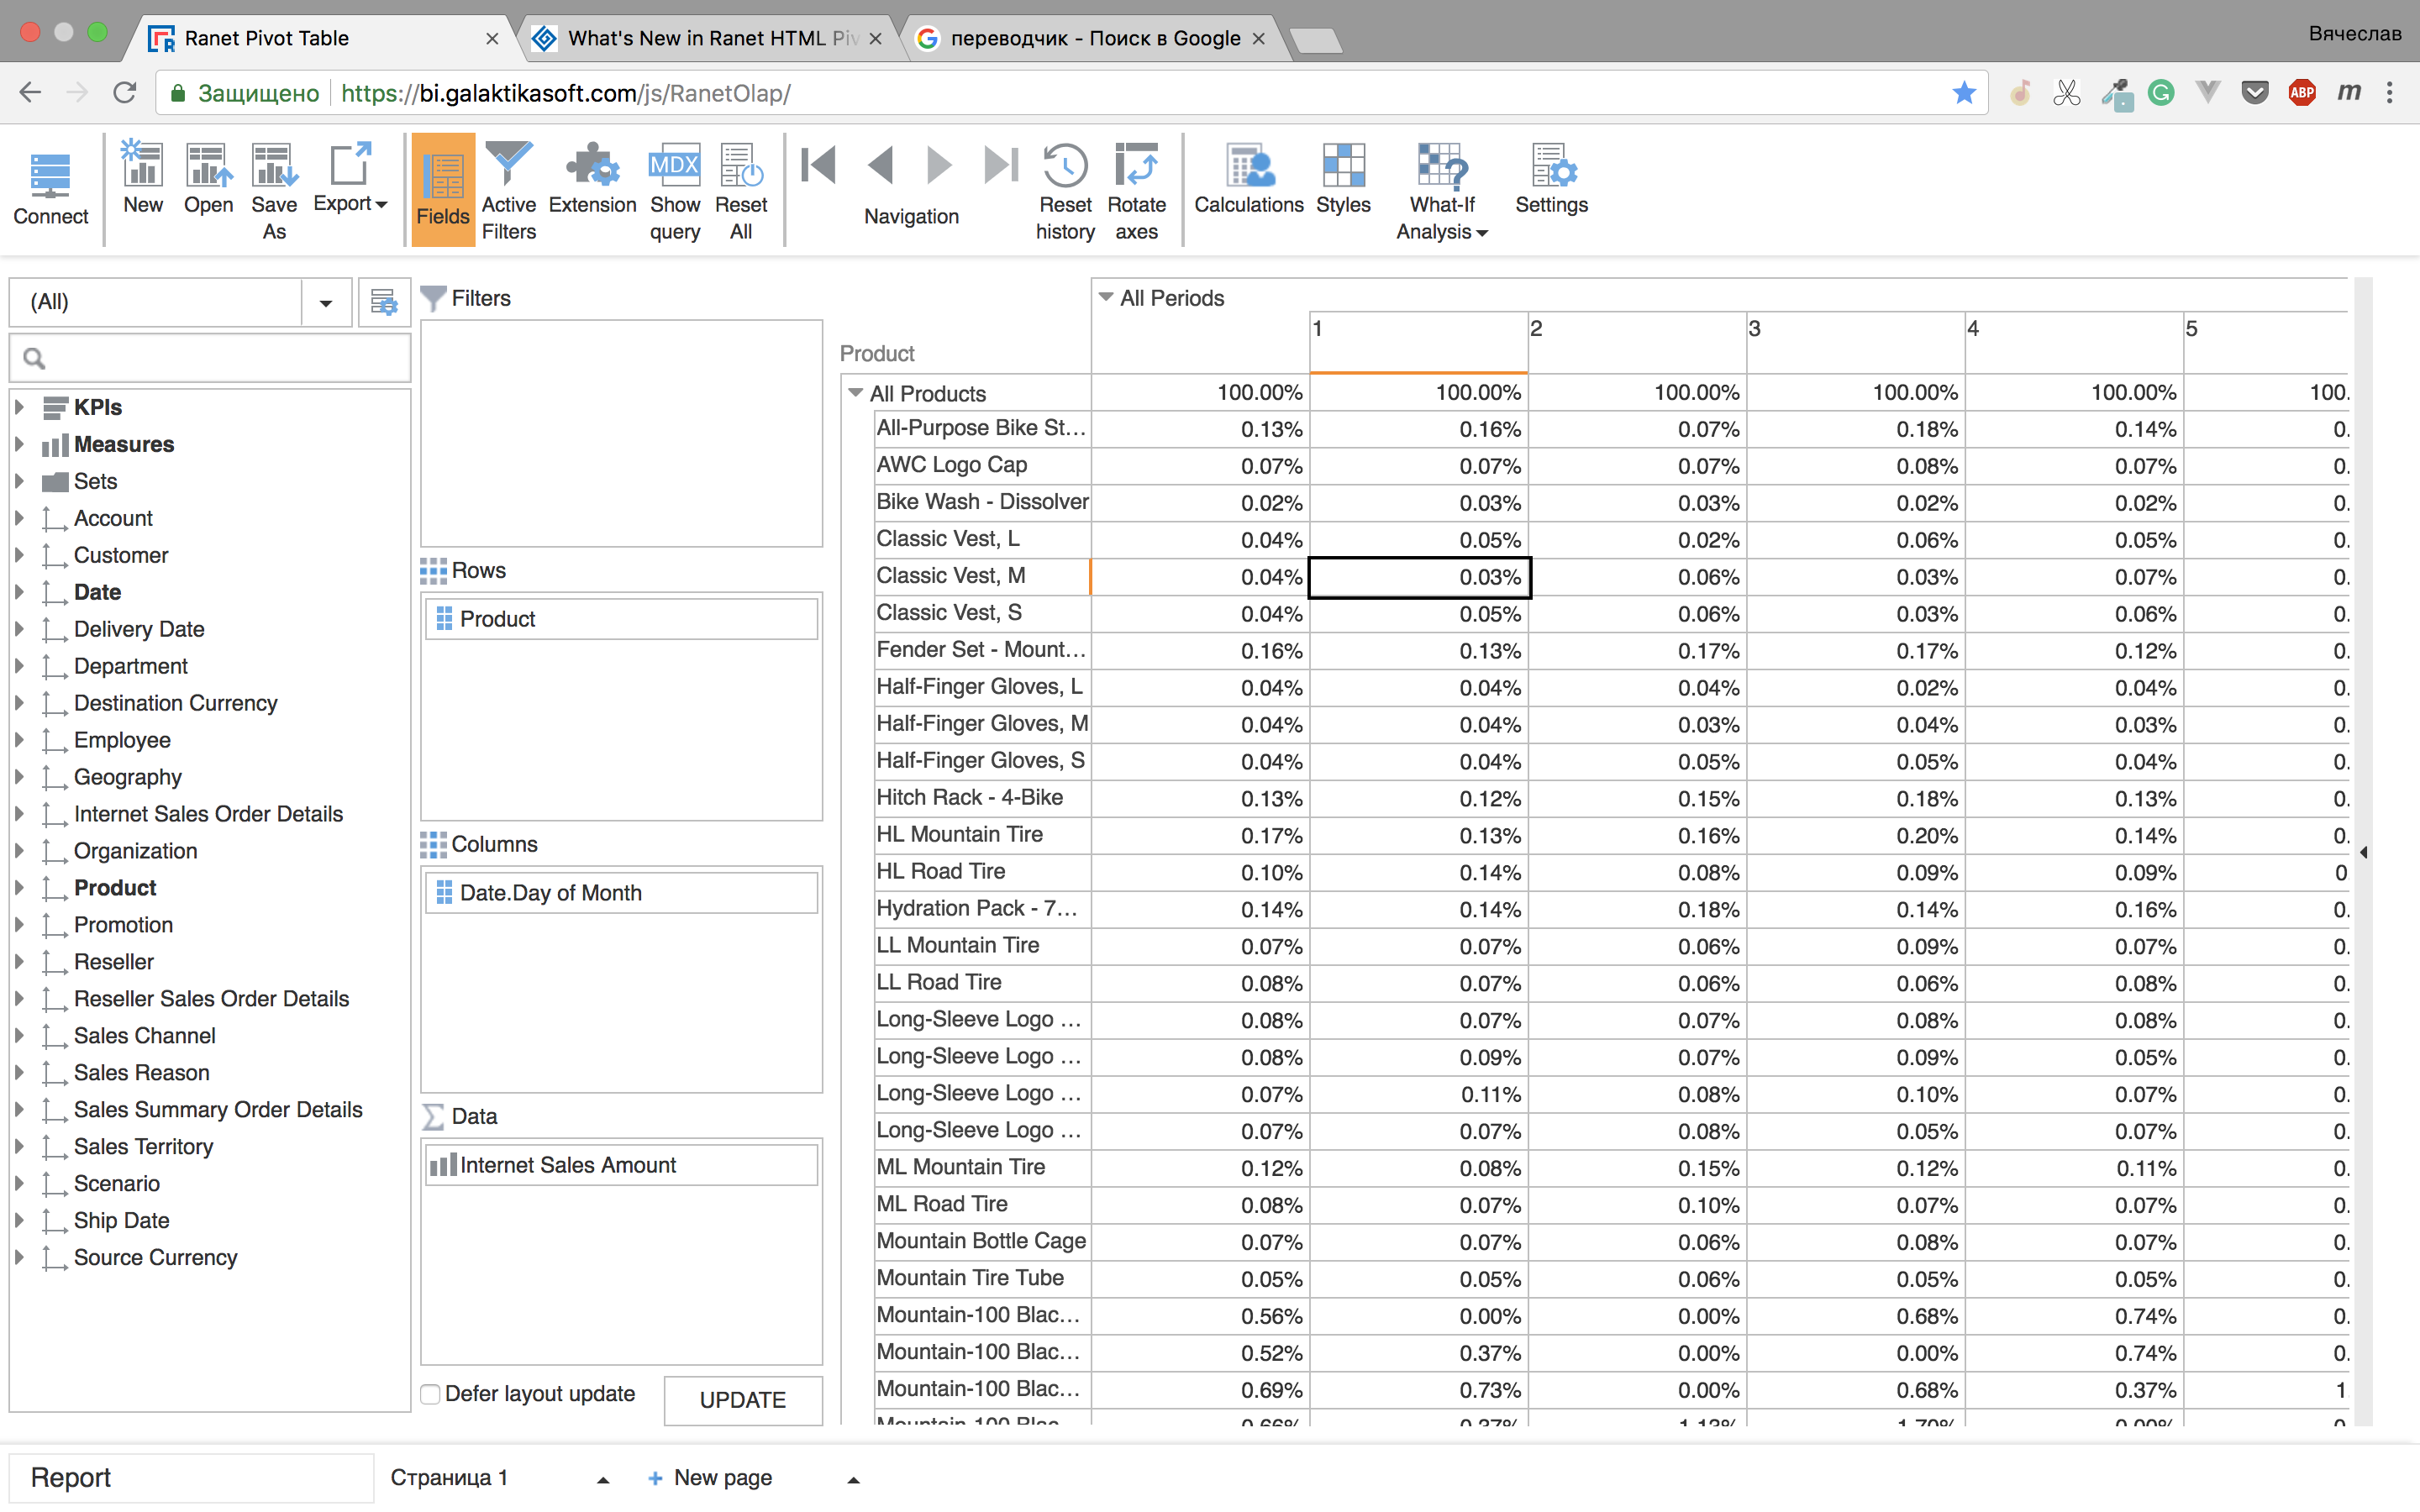
1. Column total percentage
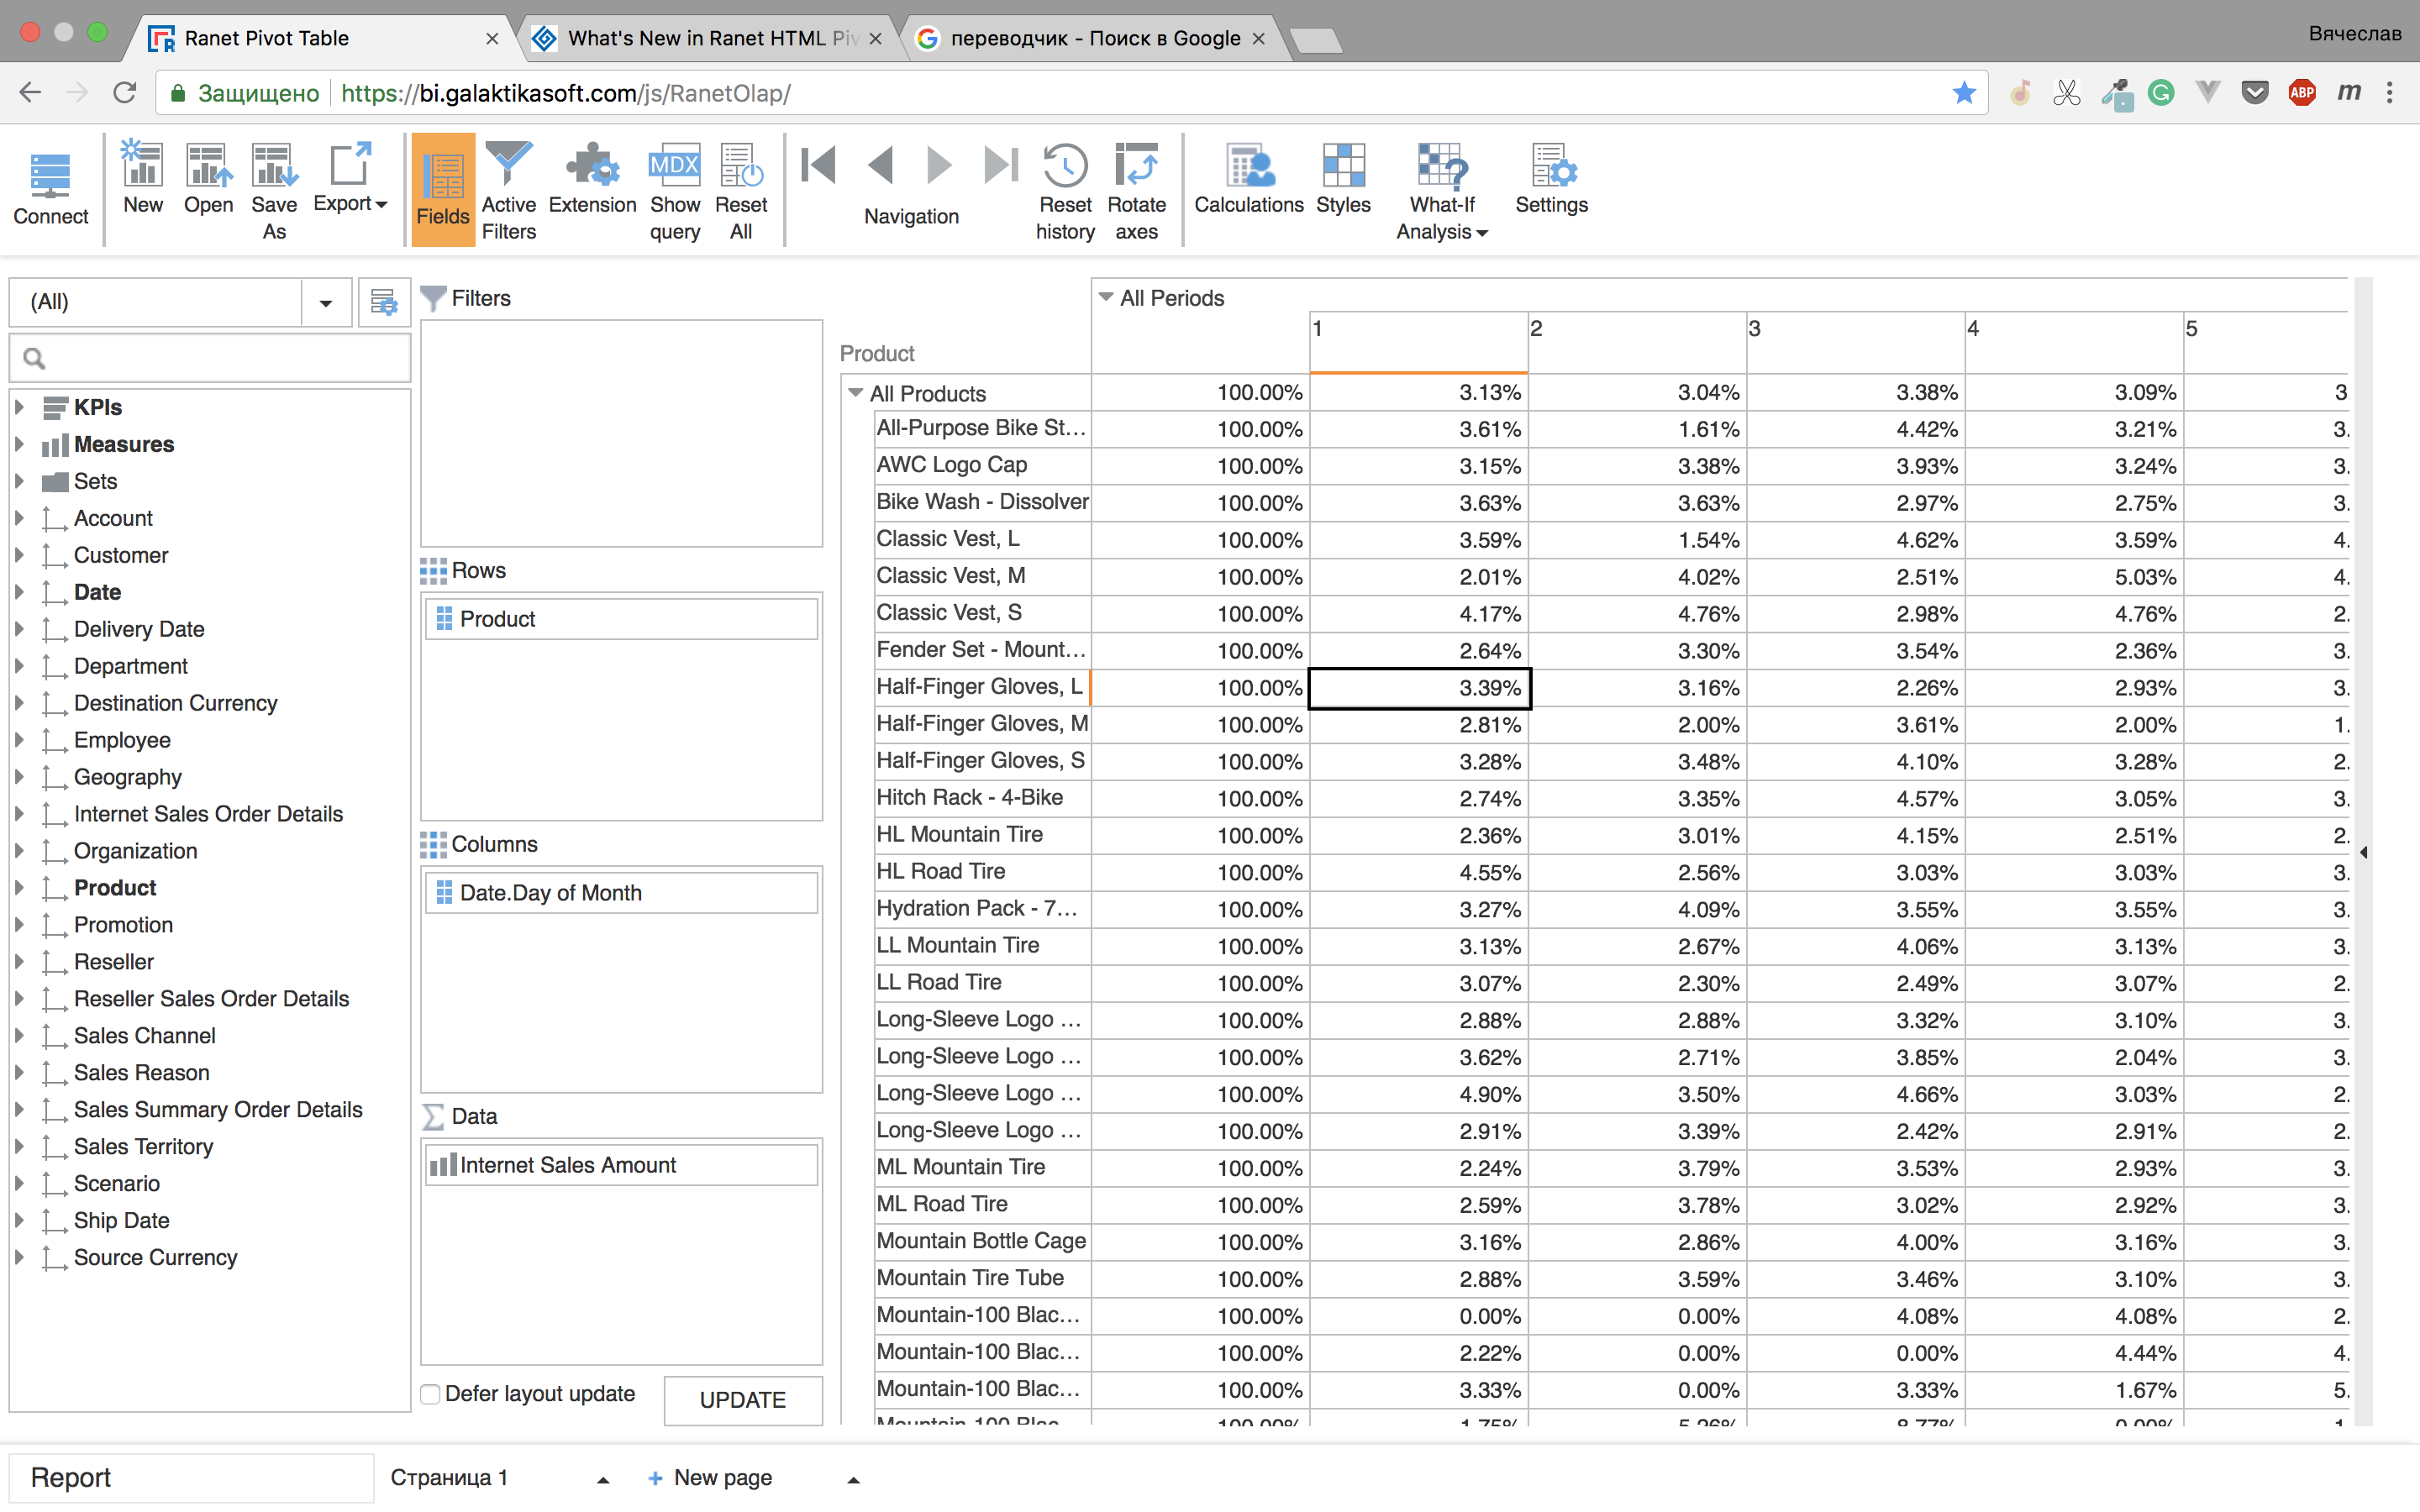
2. Row total percentage
Extended area configuration
Developers now can configure the appearance of our controls more precisely. We have extended configurable options.
For example you can hide header/footer and «refresh by click» area if your users don't use them.
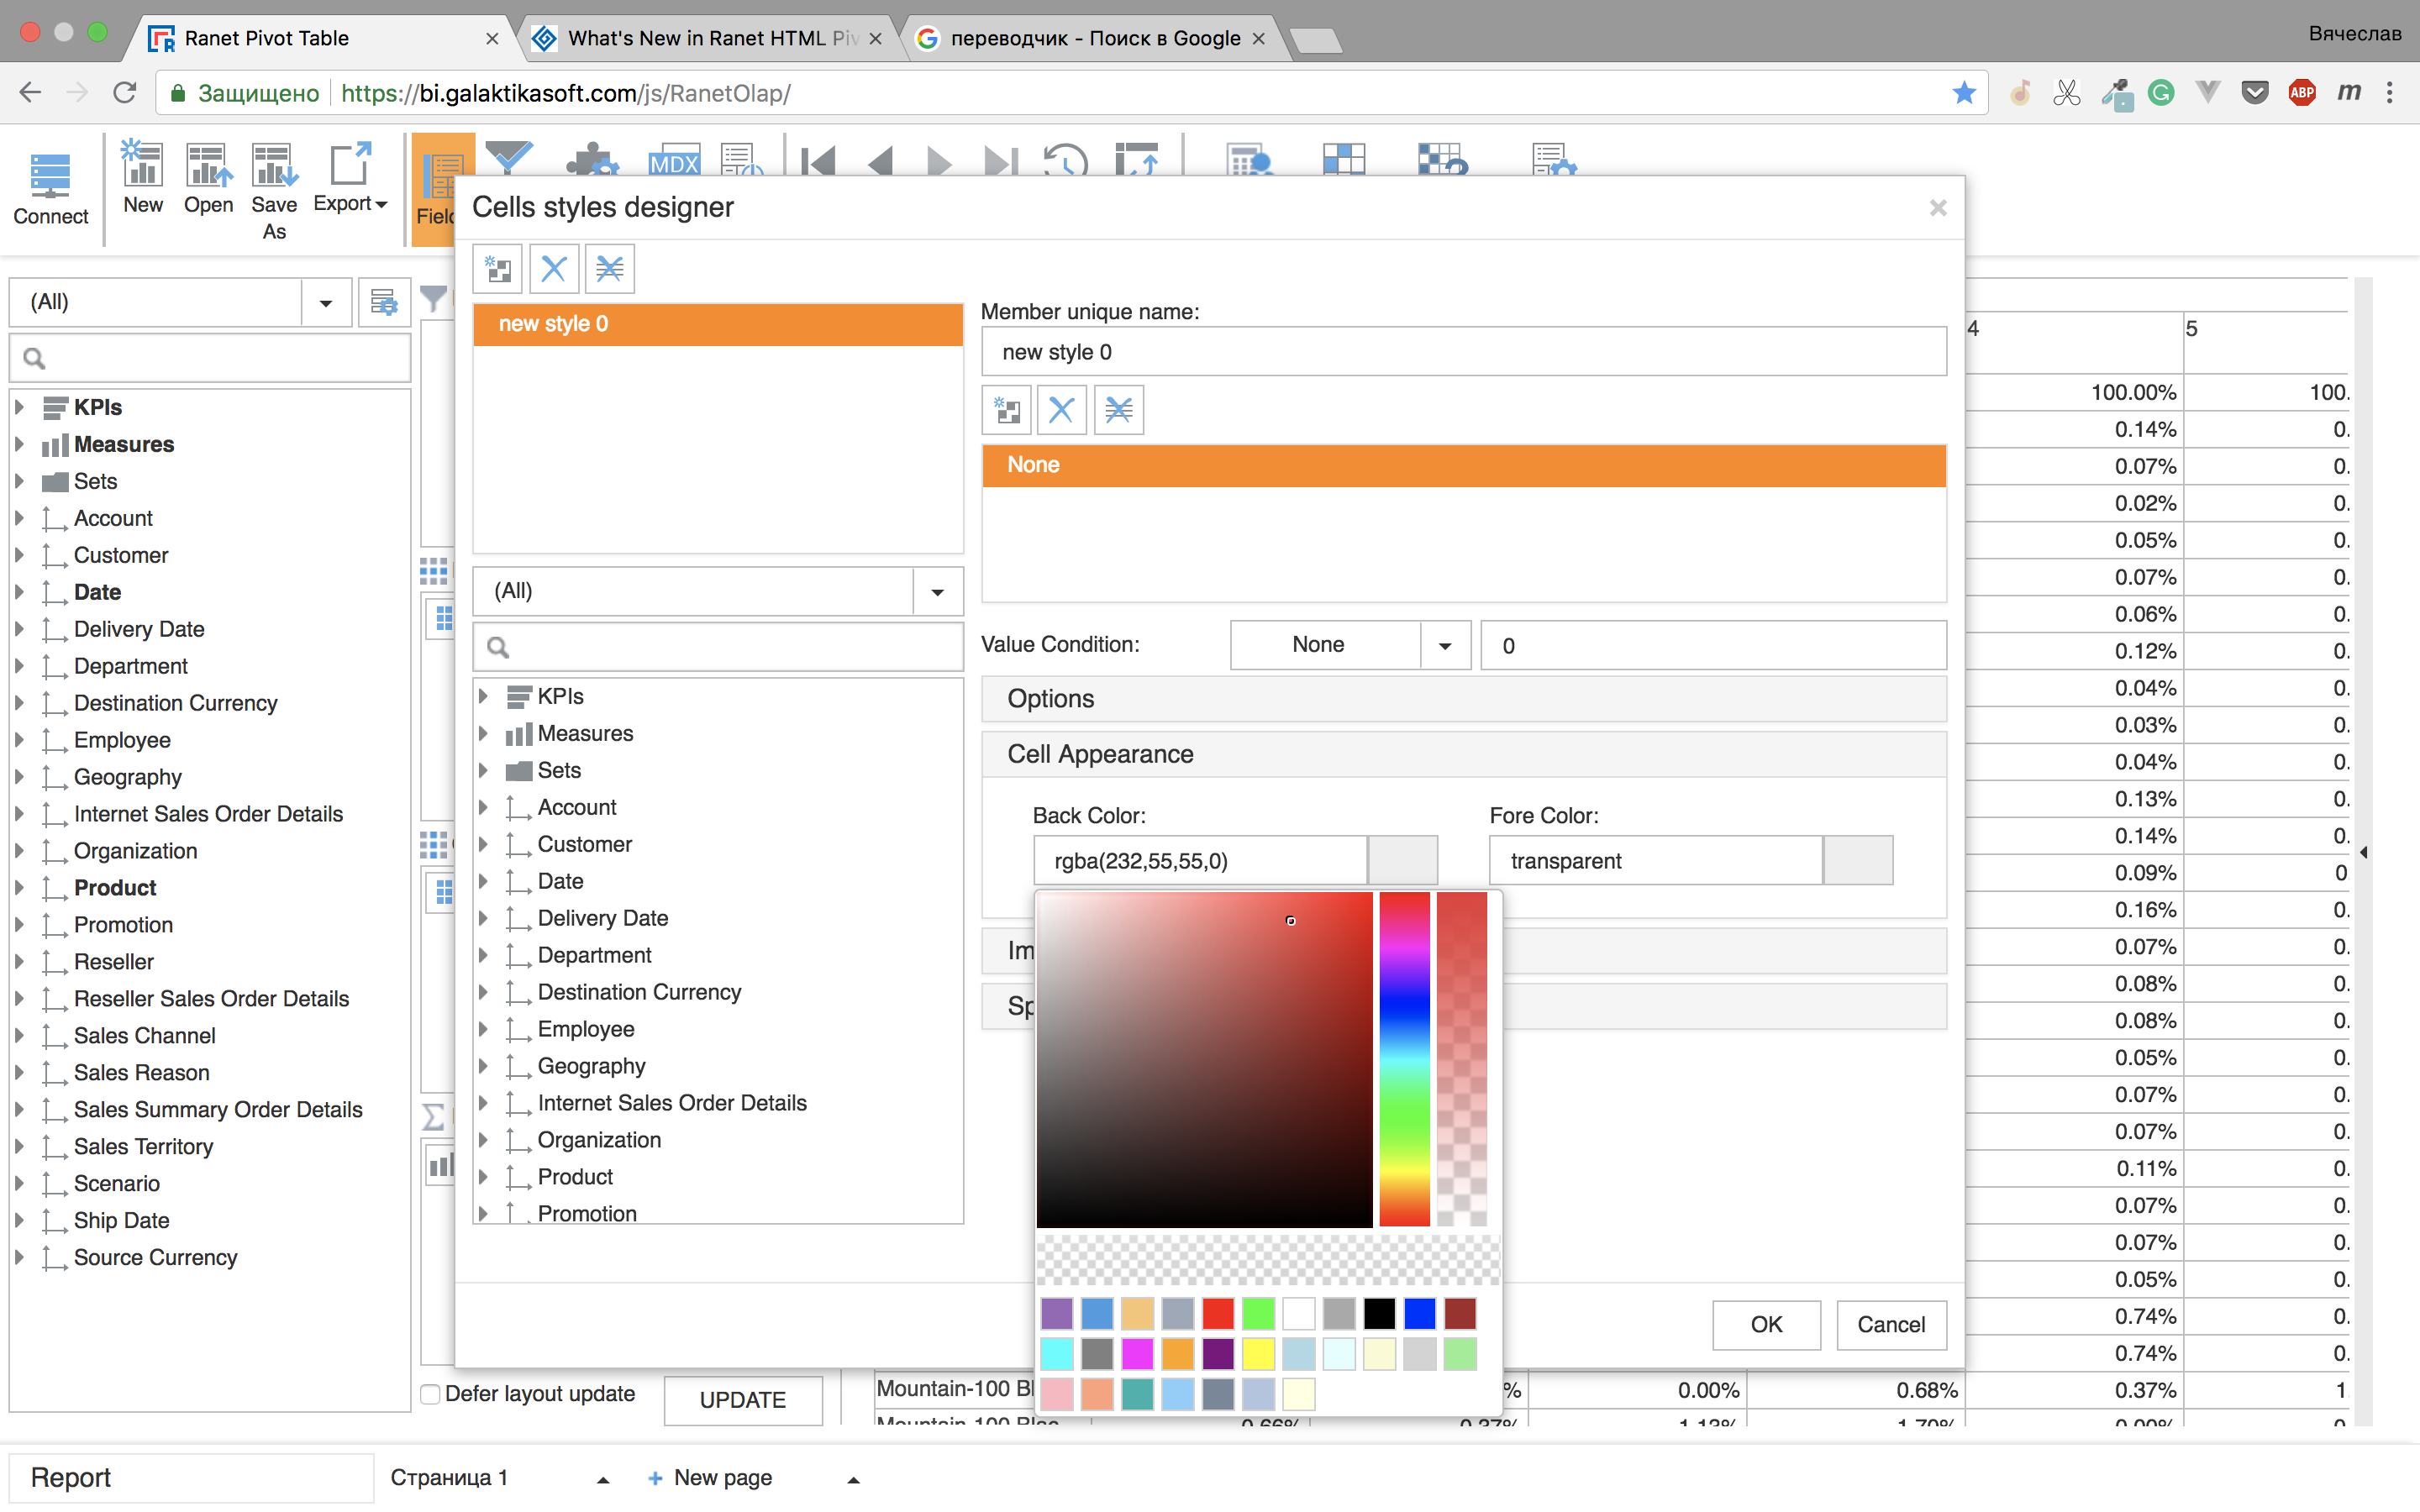
Colorpicker
We have added a color picker to cell styles designer to make it easier to configure the Pivot Table appearance. Also it can be used to configure the base color of Heat Map.
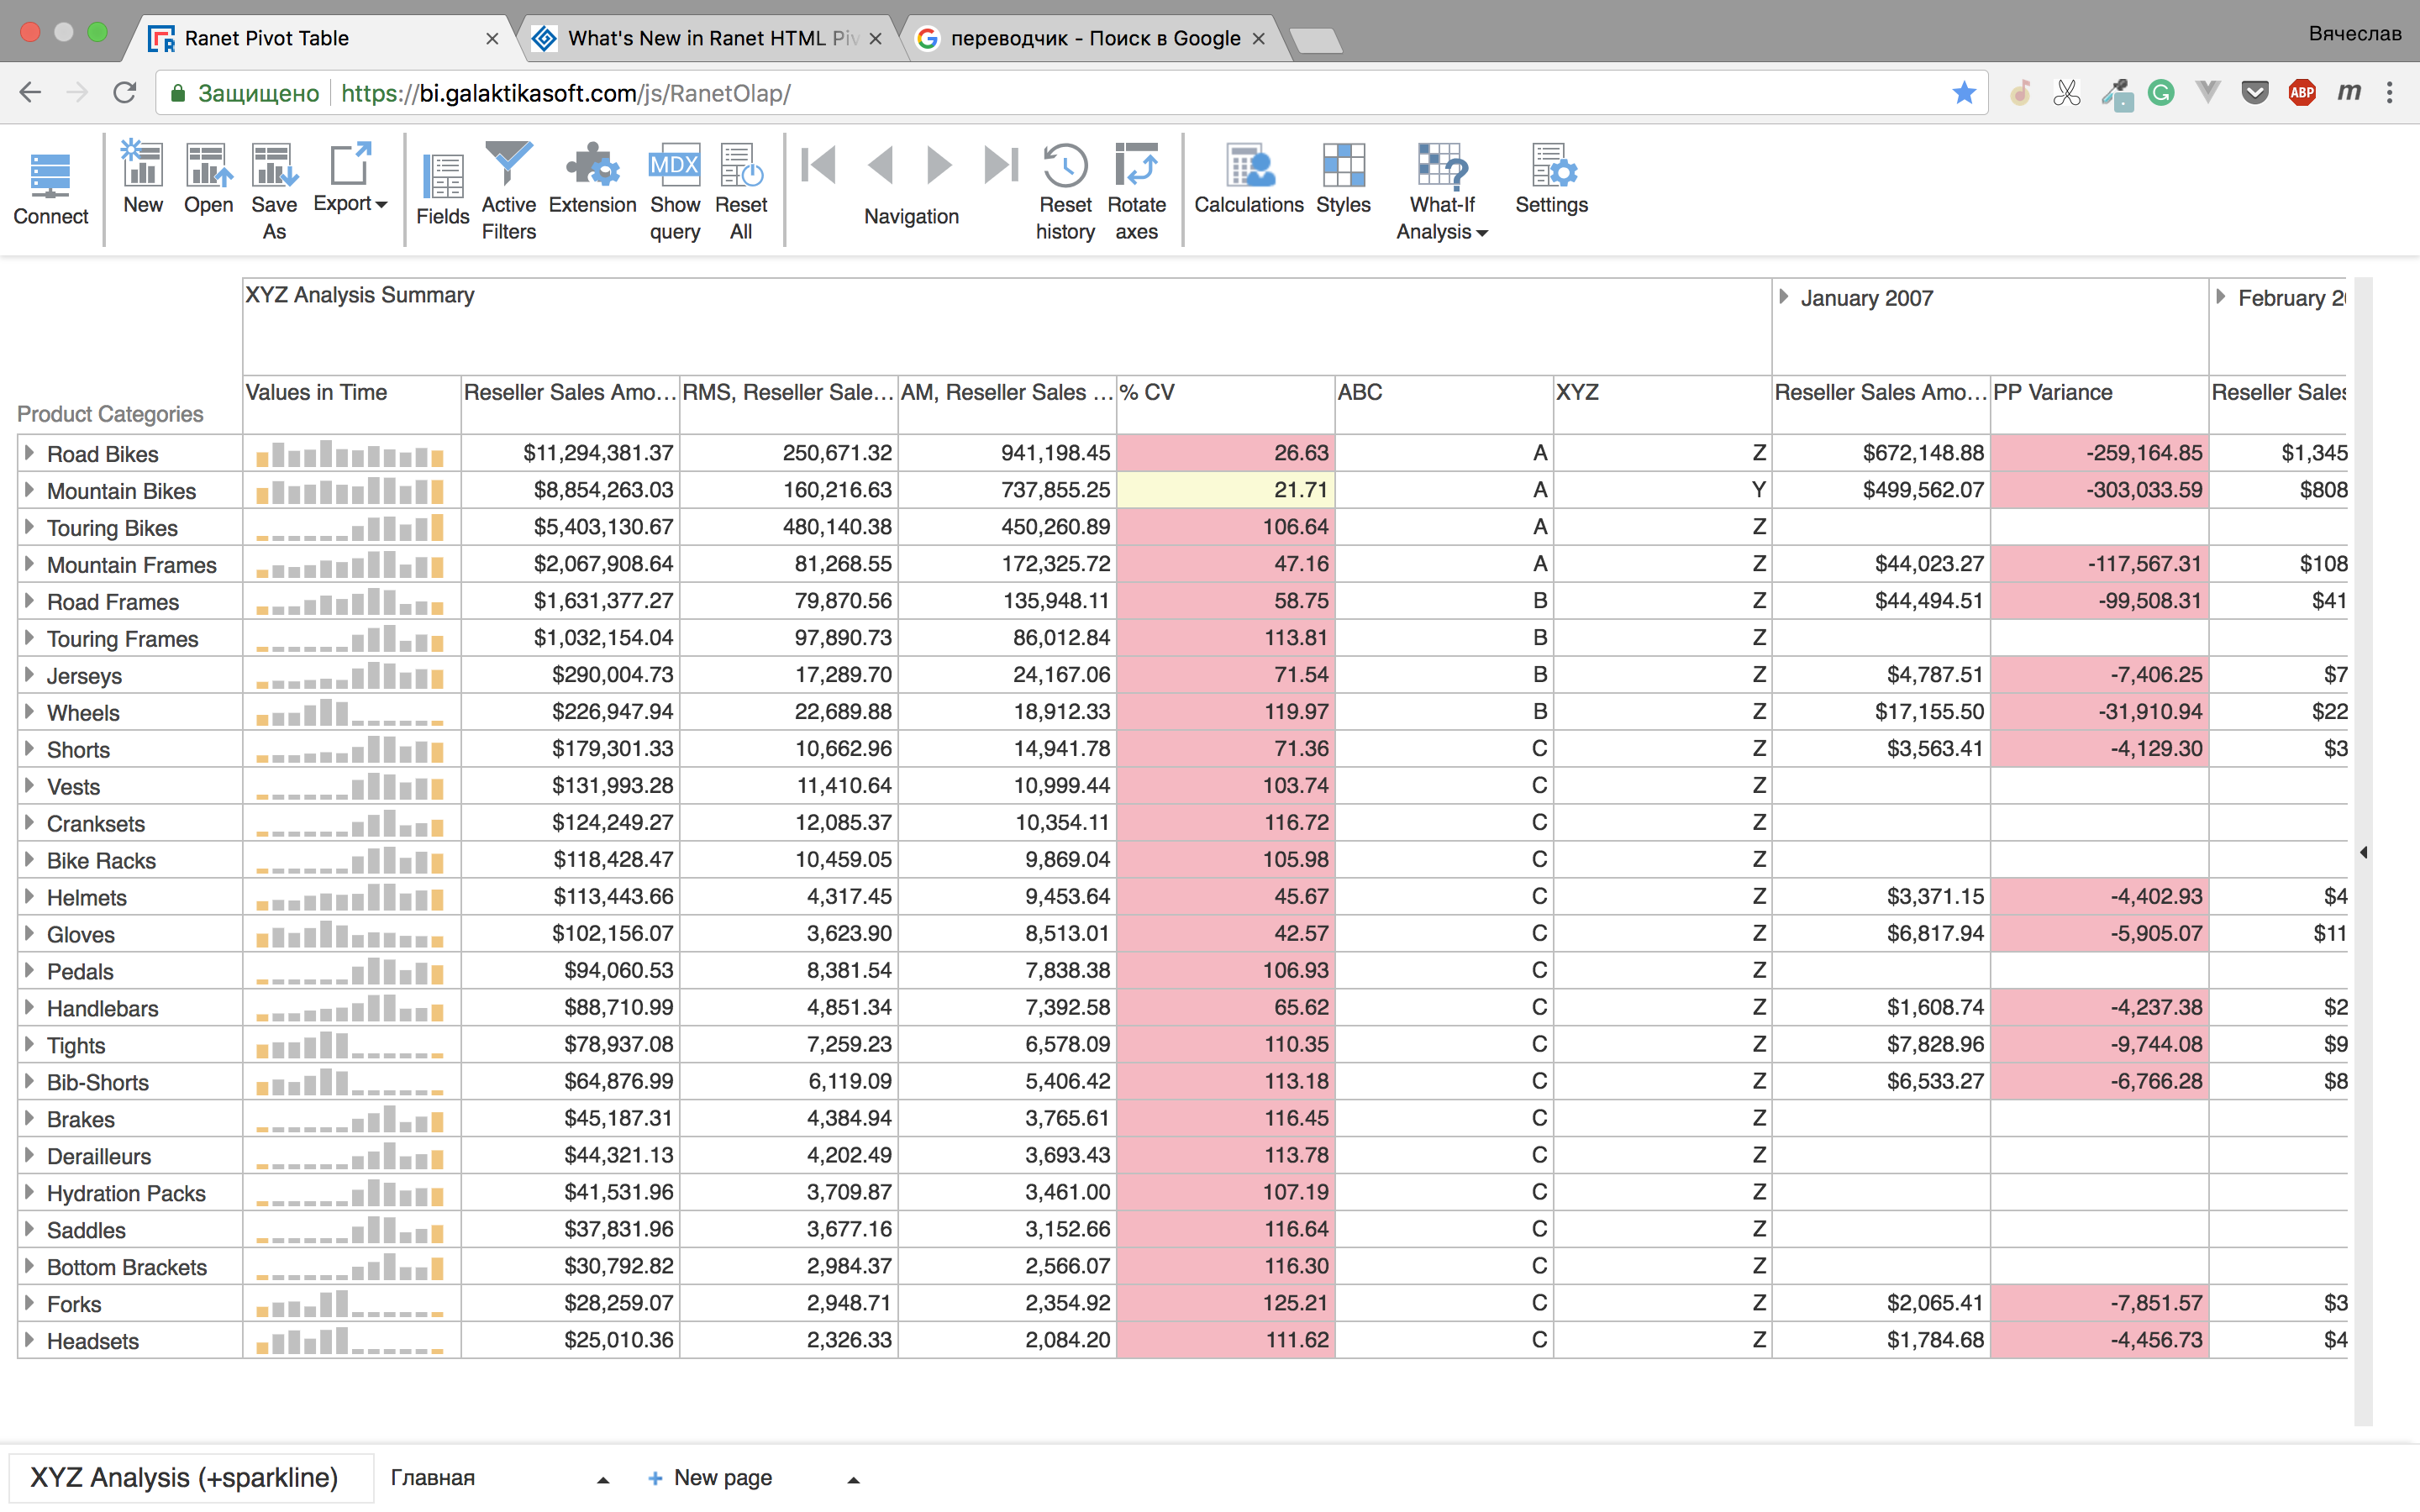
Sparklines
You now have an opportunity to add sparklines to Pivot Table. However, this may be tricky and require some MDX knowledge. Here is an example:
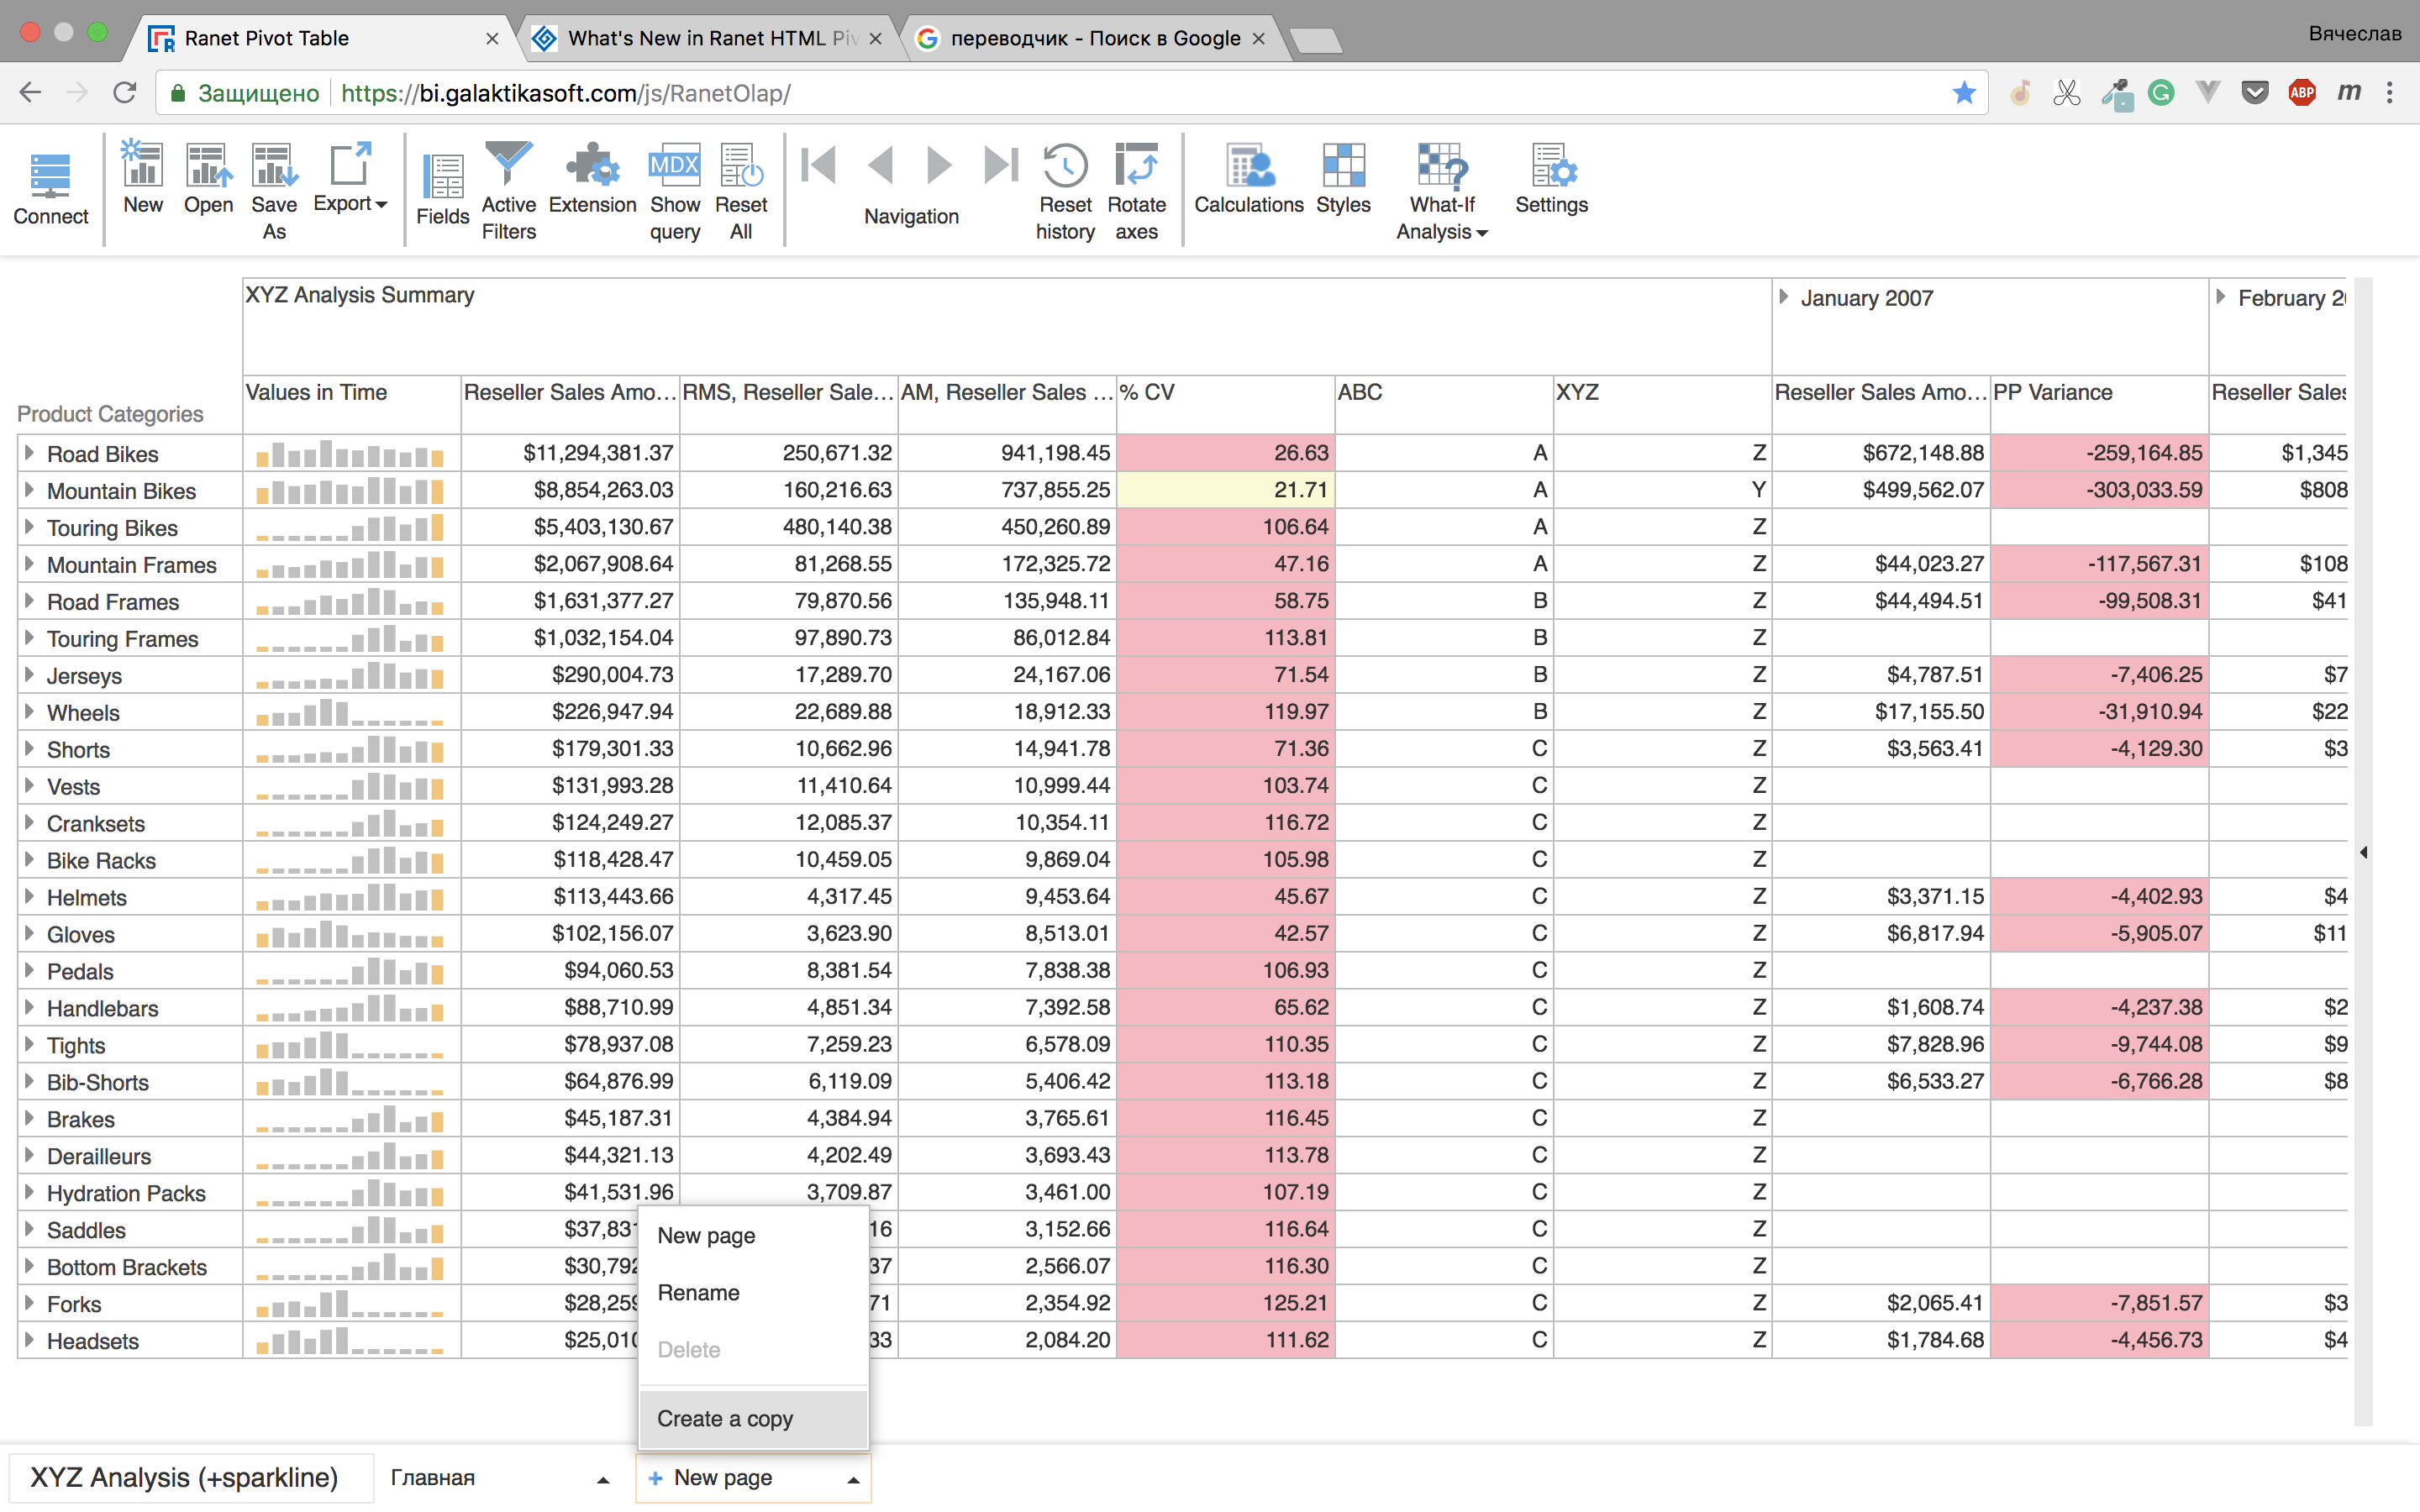
Page copying
Now you can clone your current page into a report.
Charts
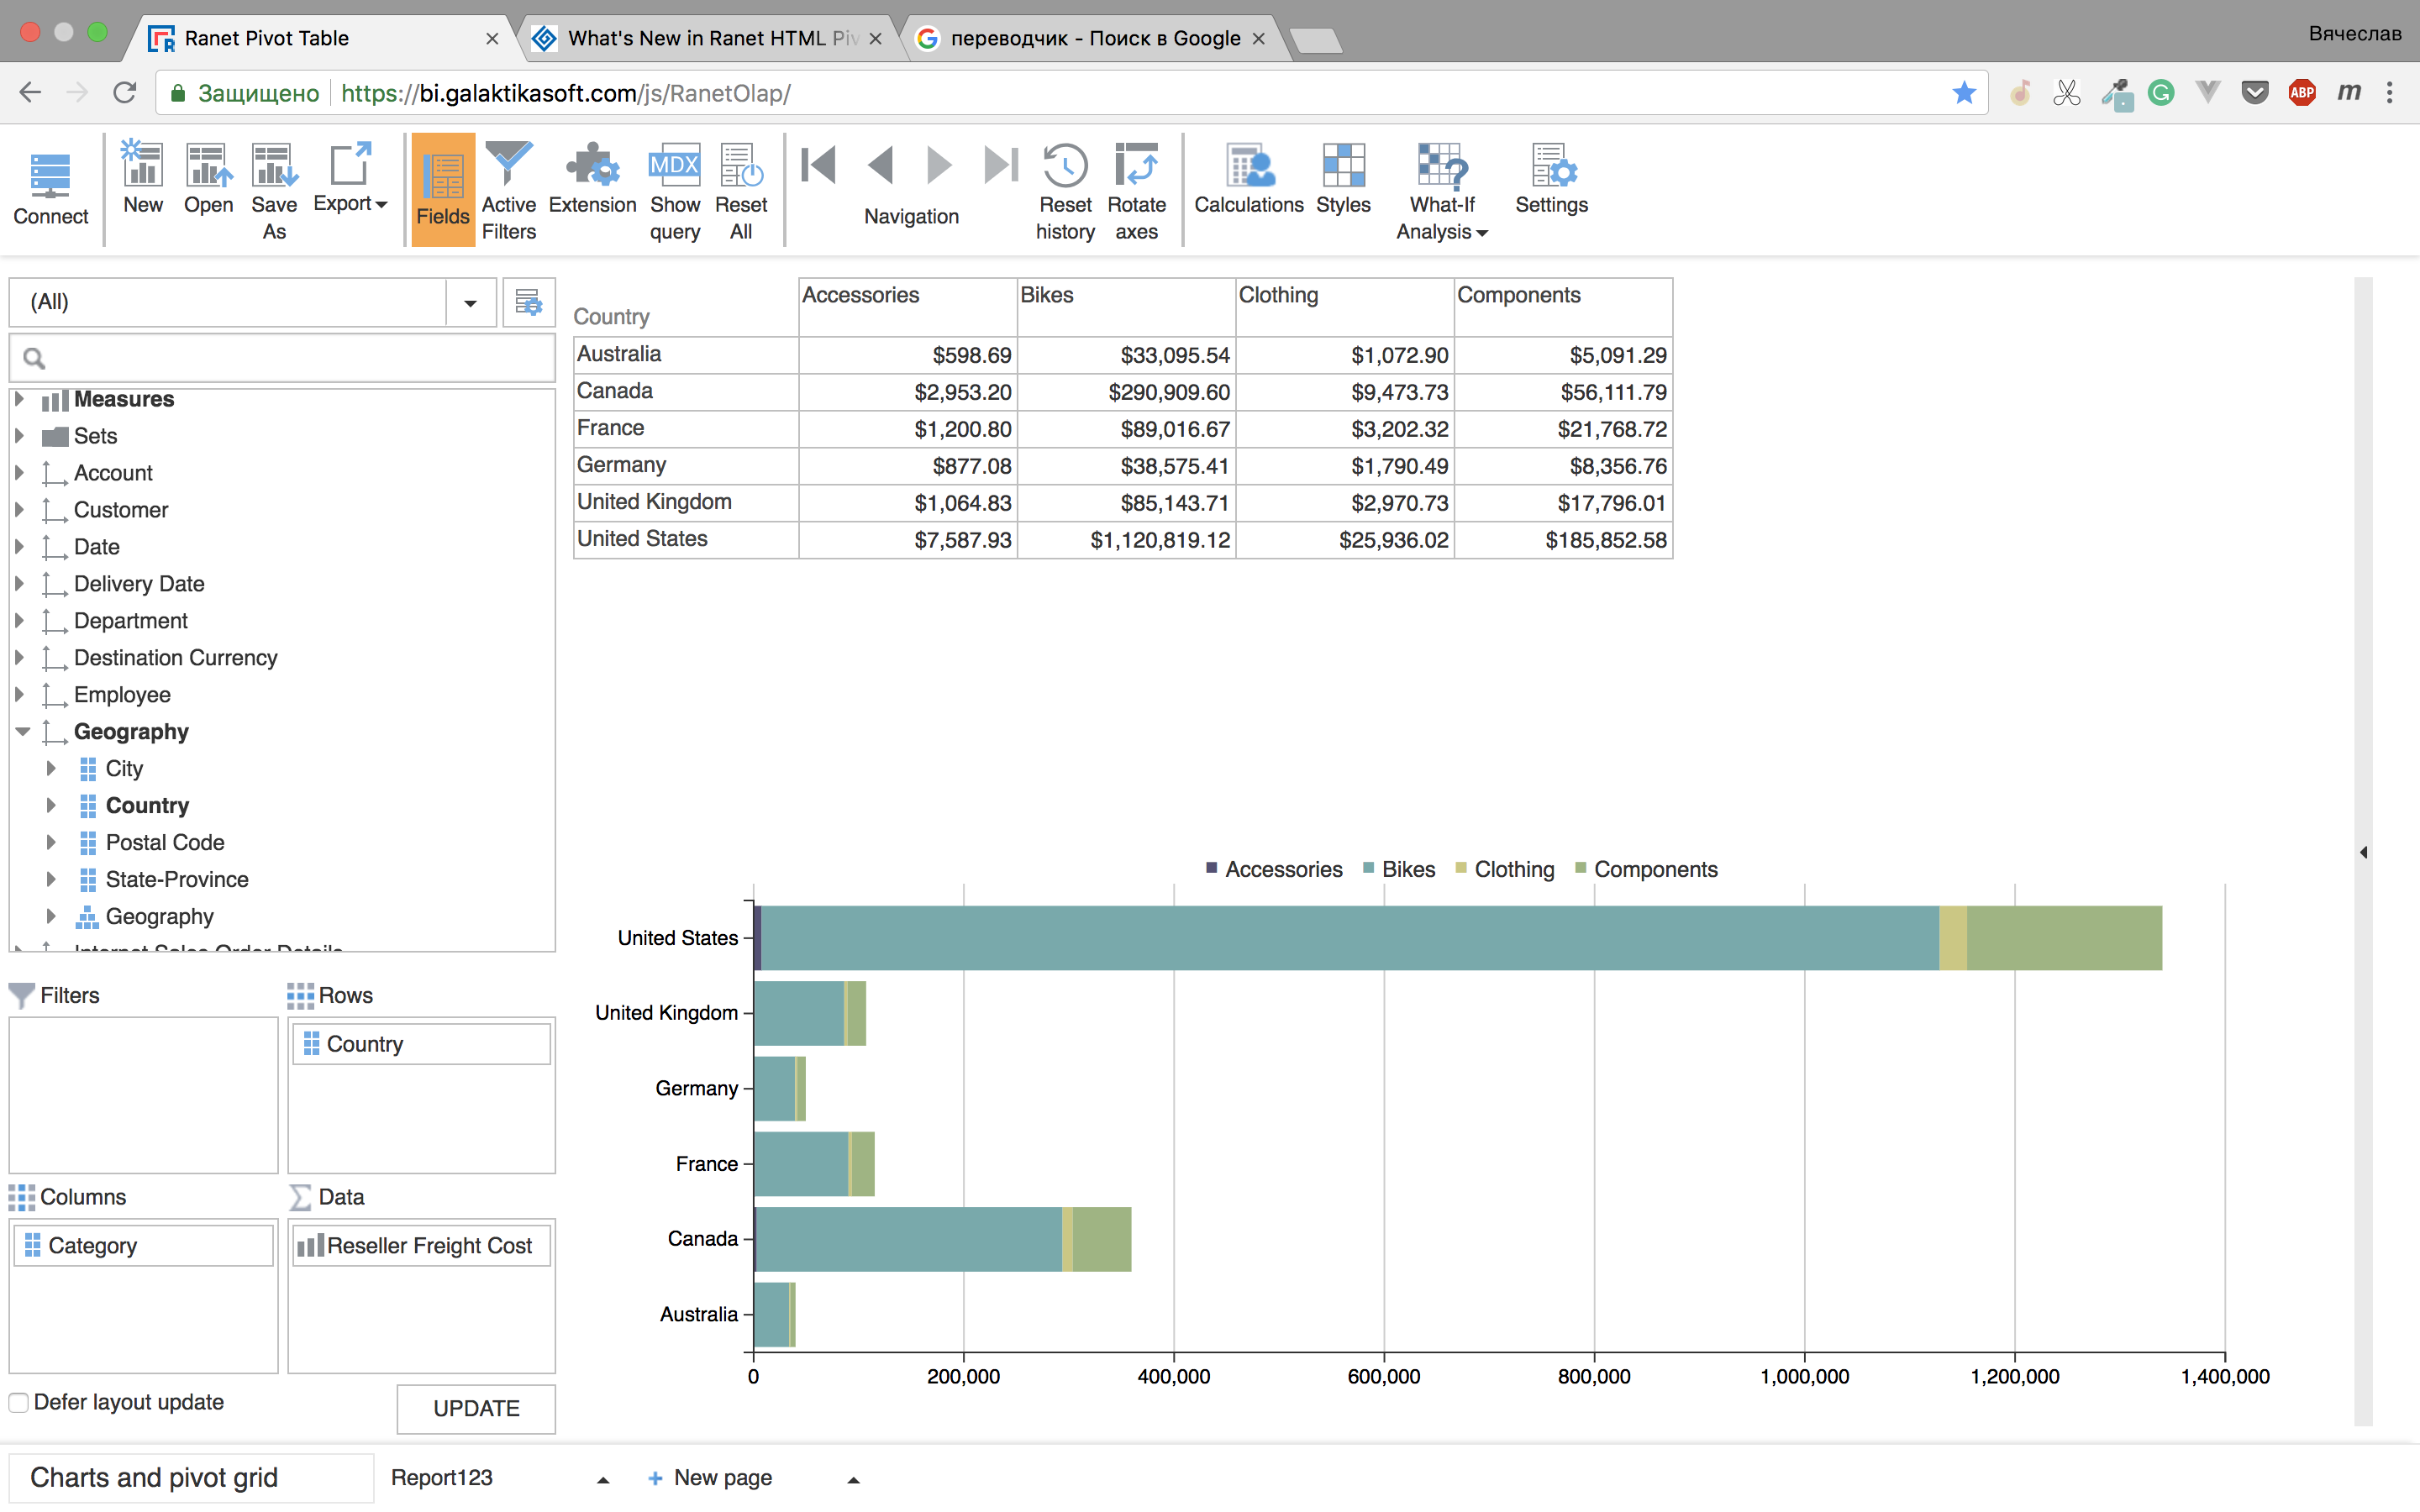
Axis swap
Now your chart can be drown not just horizontally but vertically as well:
Export
Export report in XSL and XML bypassing the client.
In this version you don't need to open our application in the web browser to export an already configured report. You can use HTTP Request to obtain a report in XSL or XML format. For example you can use it to create emails with a report by schedule.
AngularJS Application
Extended configuration, added custom event listeners.
Our AngularJS application is highly customizable now. You can call any provided method from our application controller in your JavaScript code. Almost every user interaction can be repeated using custom action. This will provide you with an opportunity to control almost everything on the page from your code. For example, you can create an empty report and add some elements to Query Designer at the moment when the application is loaded.