Report Templates – How They Help the End User
Report templates
Report templates implement advanced interactive analytical reports for multidimensional data based on Ranet OLAP Browser PivotTables.
Evaluation criteria can be determined by various indicators at the same time, forming complex multidimensional objects.
Interactive analytics "out of the box". Reach new heights and be successful in business.

Benefits of report templates for analysis:
- Ease of use and speed of analysis;
- Universality - possibility of application for any spheres of activity and any enterprises;
- Reliability of results - focus on the most valuable and promising products and customers;
- Optimization of financial, material and time resources;
- Availability - does not require complex tools and large computing power;
- Increasing the level of control over inventories, optimization of stocks;
- Improving the level of customer service, increasing turnover, increasing profits;
- Improving the efficiency of managers.
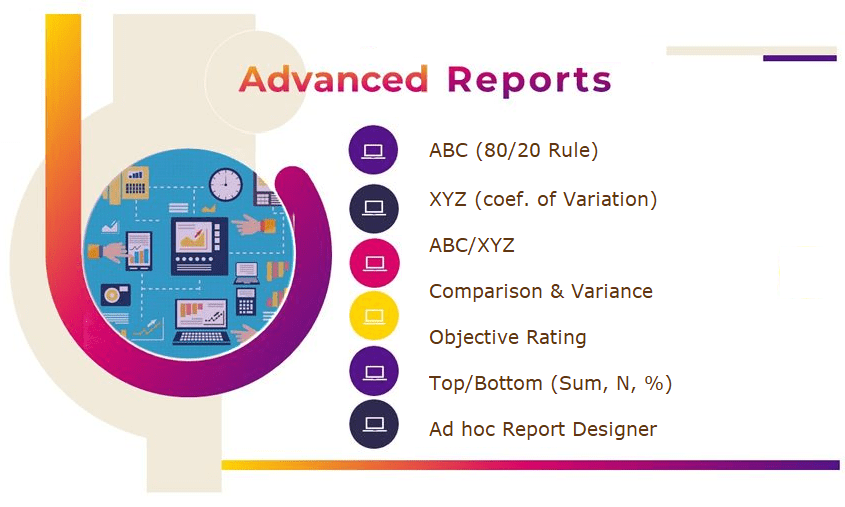
ABC analysis
How to determine which customers are most important? How do you decide what product range to sell? How to evaluate the efficiency of using stocks? The answer is: setting priorities. The most common prioritization method, which has proven itself in practice, is ABC analysis.
ABC analysis provides a ranking of objects according to their importance in accordance with the Pareto 80/20 principle: 80% of the effect achieved is provided by 20% of the effort.
ABC/XYZ analysis
One of the shortcomings of the ABC analysis is that it does not take into account the volatility of processes. This is where XYZ analysis comes to the rescue. To get an XYZ analysis, you need the coefficient of variation - the standard deviation from the mean.
XYZ analysis is a dynamic extension of the static ABC analysis.
Comparison and variance analysis
Comparison and variance analysis make it possible to study the qualitative and quantitative essence of the company's internal business processes related to the object of analysis: analysis of the work of departments, personnel and equipment, goods and services, business processes, etc. It can not only show problems or success factors, but it helps draw conclusions about their causes.
- Understand the amount of deviation
- Identify the causes and factors that cause it
- Take appropriate action to eliminate or reduce such deviation
You can compare the efficiency of departments within your company, and having data on competitors, you can compare your own performance with the market (benchmark) and make your company work more efficiently.
Rating analysis
Objective rating analysis is an effective method of ranking and evaluating objects of analysis based on several indicators - weighted (balancing) criteria. A weighted score is a standard structure for ranking objects of analysis. Determine the evaluation criteria and, in accordance with the goals you want to achieve, assign them a weight - an importance rating. This way you will determine which of the criteria is your top priority.
Сross-tabulation analysis
Сross-tabulation (structural) analysis provides detailing of aggregated indicators into their constituent data streams for one or more mutually exclusive objects. Mutually exclusive objects are entities belonging to different cube dimension hierarchies.