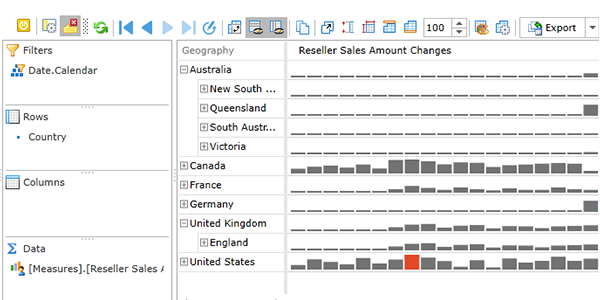
One of the most sought-after capacities of business intelligence engine is visual representation of business data in the web pivot table. We have already written about sparklines in one of our previous posts. Using sparklines is especially useful while ad hoc reporting. Now let’s see how one can create and use sparklines in the dynamic pivot table control of WPF and Silverlight versions of Ranet OLAP.
In terms of Ranet OLAP, a sparkline is one of the format string types of custom calculations used to demonstrate the changes in the indicator value over a certain period of time. They help users to spot trends and seasonal changes in business figures. The value of the calculated member is an array of data where value points are separated by a special character “|”.
Let’s see an example of creating a sparkline to show the dynamics of reseller sales by months.
First, we need to create a named set for the period of time. We will create a named set for all months available in the [Date] dimension, and can later select the period we need through the Member Choice. See the video below for the details.
Then, let’s create a custom calculation that will form the sparkline in the pivot table cell. In order to do so, we need to include a condition to check whether there were any sales in each month. If there were, the Generate function creates an array. If there were none, a NULL value is used. We use Sparkline as the Format String. See the details in the video below.
Now, let’s use the sparkline we have created to design a pivot table report reflecting the dynamics of reseller sales in different countries in 2006-2008.
The default type of sparklines used in custom calculations is line sparkline. You can change it in the cell style designer as shown in the video.
We hope this post was helpful to you. Feel free to contact us in case you have any questions about using sparklines in Ranet OLAP pivot table control.
