What is Ranet Analytics?
Ranet Analytics is a set (collection) of components, services and applications that can interact with each other when building BI-solutions.
Our methodologies and practices for developing BI-solutions and delivering projects will help you more effectively integrate analytics capabilities into existing systems and, consequently, into your organization's business processes. You will save time and money, and your employees will be able to make better decisions.
Learn what Ranet Analytics is, how to use it in your application solutions, and how to get the most out of it.
Ranet Analytics Components
Ranet OLAP Browser
Visual elements, services and express reports (Ad hoc reports) based on pivot tables, analysis and modeling What-If using Writeback mechanisms for OLAP data provided by Ranet UI Library for OLAP will help you quickly develop a complete analytical reporting module in your application.
Numerous end-user-focused features and analysis services provide excellent ergonomics and effectively solve most of the routine analysis problems and increase productivity, help your users focus on business tasks and relieve developers of most of their requirements for developing new reports.
Ranet Dashboards
Interactive dashboards and analytical express reports.
Visual business intelligence tools that allow users to monitor and analyze various business metrics, build interactive reports in the form of tables, charts and graphs, share them and collaborate with other users.
Interactive data visualization provides tools and processes for visualizing data, exploring and analyzing data directly from the dashboard. This user interaction allows you to reveal information that will lead to effective data-driven decisions.
Data source connection management, built-in visual dashboard designers, integrated security based on user roles.
Ranet Datakit
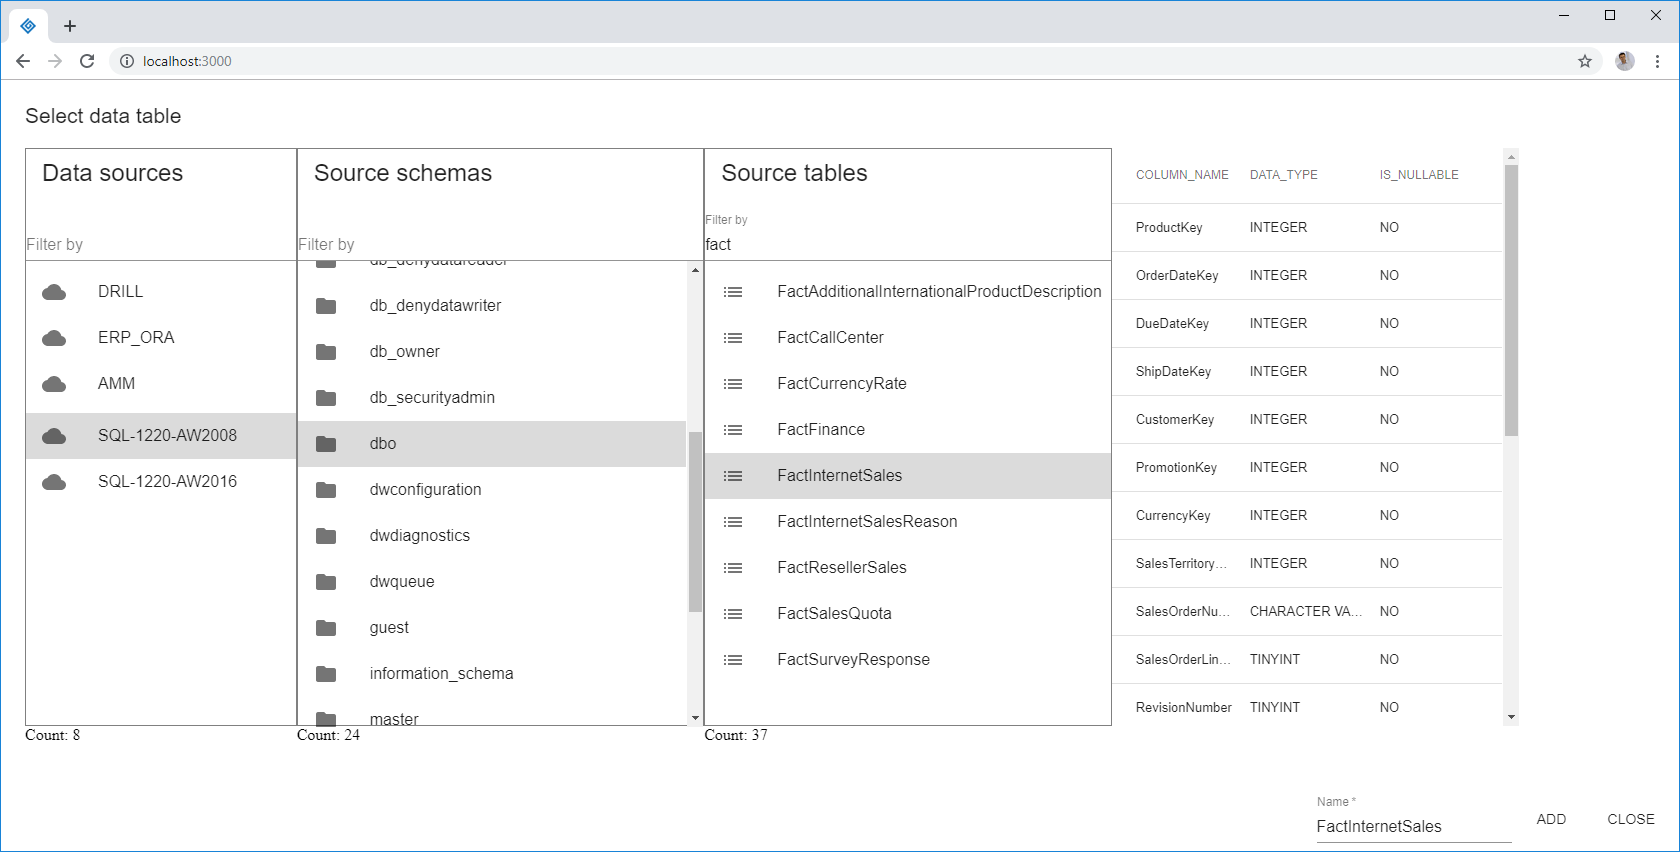
Federation of heterogeneous data sources for Apache Drill and Apache Spark platforms, publication of data from federated sources in business terms that are understandable and familiar to the end user.
Ranet Mondrian
Alternative Microsoft SSAS OLAP server based on Pentaho Mondrian. Full support for Microsoft Excel.
Ranet CPM
Tools for developing budgeting, planning and reporting consolidation solutions. From data analysis to high quality planning.
Zaaml
Visual user interface elements and services for WPF.
Ranet Analytics Features
Advanced Report Templates
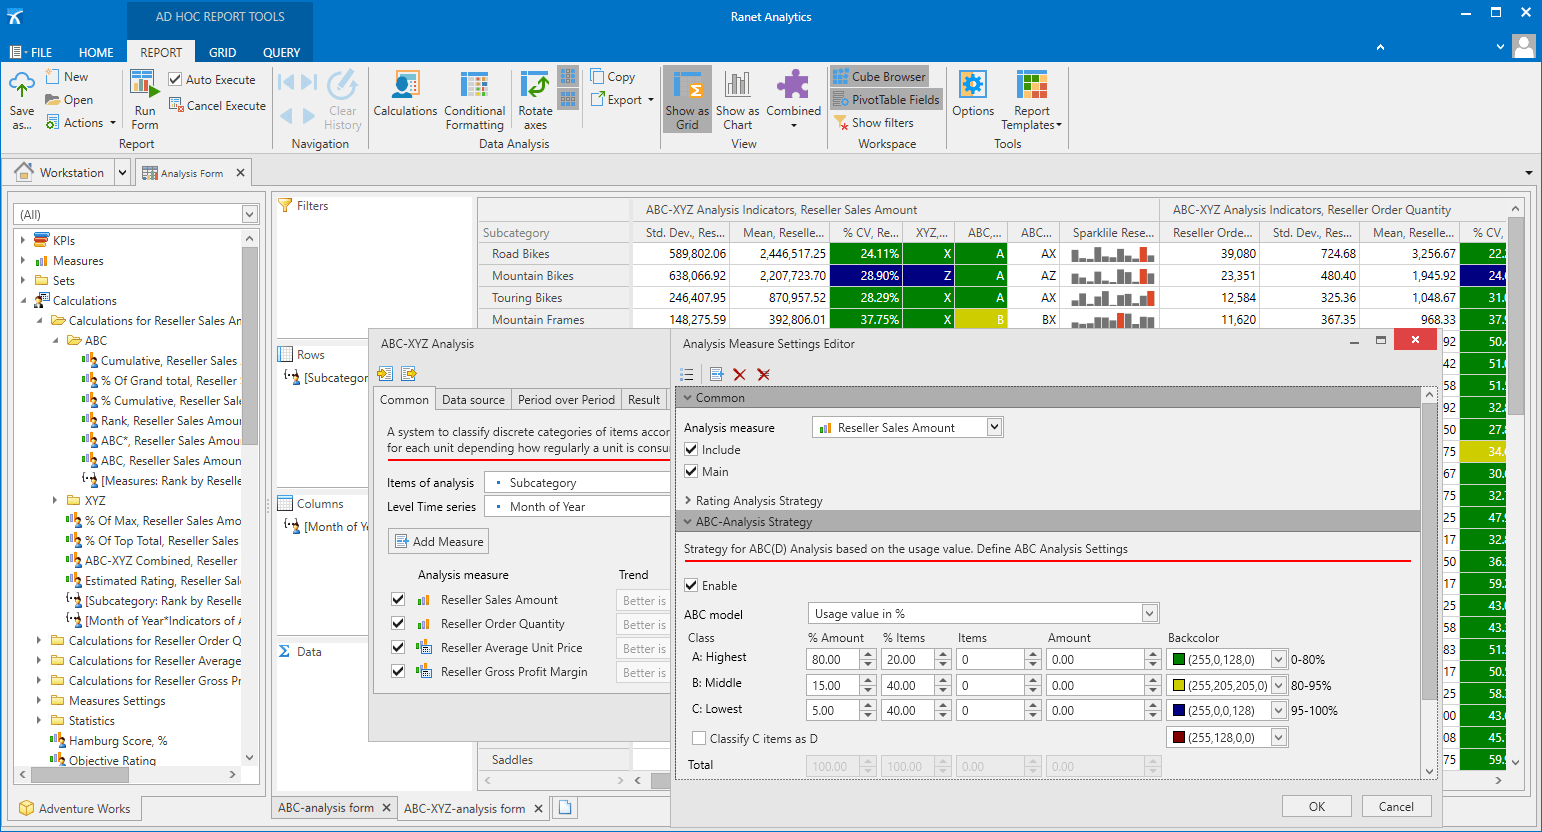
Report templates are created using powerful visual designers where you can customize all report options. You can manage the report structure and all its settings, such as enabling/disabling filters, using color categorization, etc.

Evaluation of objects by several indicators
With Ranet Analytics, the one-dimensionality of analysis methods is no longer a limitation.
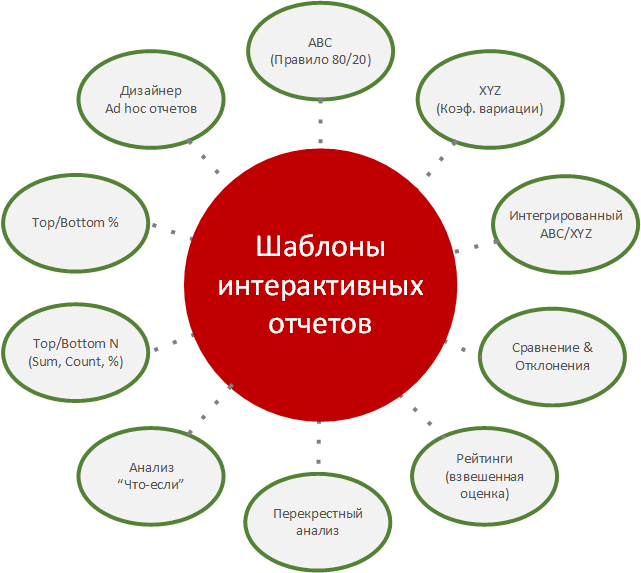
Report templates provide the ability to evaluate and classify complex multidimensional objects by several indicators at once with their own analysis rules for each of them.
Approaches to the usual methods of economic analysis are radically changing. They become popular and effective. Built-in methods of economic analysis, such as: ABC, ABC/XYZ, comparative analysis with deviations (volume, price, quantity, exchange rate), rating, etc. save time.

Visibility and all-round analytics
Reveal the hidden ideas in your data to grow your organization's business!
Use visual analytics - an innovative way to interact with data, explore and manipulate it.
Federation of Heterogeneous Data
A virtual database in business terms based on data from various relational databases. Ranet Datakit transforms the data into a common model and provides a single data source.


