Ranet Analytics
Ranet Analytics gives the services providing the workers of your organization with Business Intelligence (BI) instruments, which allow the workers to make reasoned decisions. The main task of the dashboard is to provide the visual presentation of information about some aspects of the business, give the resources for its interactive analysis, simplify for a user the search of dynamically changing information, which is necessary for making decisions and as a result help you to trace and estimate the effectiveness of your organization.
Key benefits and features
Easy Interactive Dashboards
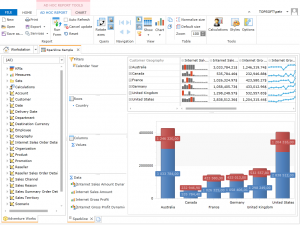
Enables to create functional and ergonomic interactive dashboards for analysis of organization activity indicators. The embedded designer and a big set of interactive visual elements for data displaying provide maximum information visualization on business indicators.
Ad hoc report
Build interactive dashboards with no tech skills. Any user who is acquainted with Microsoft Excel summary tables can quickly set a report with a summary table and a diagram for interactive indicator analysis.
WEB
Ranet Analytics is an application with plentiful interface, The App works in any web-browser. It makes possibilities to zoom the application easily and connect new users, publish dashboards in the Internet.
Mobile & Touch
Play with dashboards right from your mobile. Ranet Analytics enables to publish dashboards for its display on mobile devices, smartphone and tablets PC. There are no limitations for iOS and Android platforms as there is an ability of dashboard publication in HTML5 format that makes an opportunity of displaying them on any mobile devices and any platforms.
Embedding in Your App
Ranet Analytics allows our partners to embed the app in their own solutions and make its rebranding. The application can be effectively used realizing BI tasks, budgeting and planning, as it has visual elements for entry and analysis of data. It is data entry forms with Writeback function support and an interactive summary table correspondingly.
Data Visualizations
Ranet Analytics has a plentiful set of graphic elements for data visualization. Dials, diagrams and graphs, tables and other visual elements make an opportunity to display information in maximum ergonomic way and embedded Drill Down/Drill Up functions help to research data from aggregate meanings to real operations.
Administration & Configuration
Ranet Analytics has a flexible security model based on roles that enables to administrate users flexibly taking into account their responsibilities in business-processes of the system. The administrator can easily customize users’ access to the access to concrete dashboards and even their certain widgets.
Toolbox Widgets
Tables
Objects
Filters
Commands
Common
Tools
- Olap Session
Install & Configure
To install Ranet Analytics, download and run the Ranet Analytics Setup program on your (web-server) computer.
Installation and deployment
Before logging on to Ranet Analytics you should learn the basic definitions and terms of the system, it helps to get the hang of working with the product and open up its main functions.
Online Demo
All analysis tools and finished reports are available via the web.