Developer tools
Ranet Analytics provides services enabling to create dashboards that include holistic, consequential and important information in the context of your business (it enables to develop proper BI-applications). Ranet Analytics has its own development framework whereby you can create and publish on the website dashboards, reports and metrics (hereinafter «Dashboards) that display important and key performance indicators (KPI) of your business.
Main tool capabilitie
- Flexible design capabilities of display forms (dashboards);
- Support of relational (flat tables) and multidimensional (summary tables) data sources;
- Interactive data visualization elements (Widgets);
- Developed business graphics;
- Data display on electronic territory maps;
- XAML DataTemplate support offers unique opportunities for realization of display forms of a random view;
- Support of the parameter tool enabling to reorganize reports dynamically in dependence to a user’s choice;
- Writing proper scripts and algorithms using Python;
- Organization of connections and interaction between dashboards and data visualization elements;
- Data editing in a table with saving in a cube (support of write back tools in a cube, Writeback );
- Publishing of dashboards on portals;
- Combined work on dashboard design;
- Work with a tool through the web-interface.
It is design services of dashboards (Design Time).
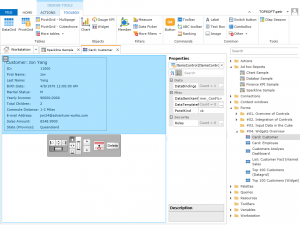
Approach WYSIWYG (What You See Is What You Get) is used if operating at the embedded designer (constructor) of dashboards that enable to create dashboards maximally similar to those that a business-user will see. A numerous library of simple and interactive visual elements allows creating visually attractive, ergonomic and effective display forms for data presentation to a business-user. Text fields, images, selectors, filters, command buttons, dials, diagrams, tables including summary tables for display and edit of data from multidimensional source and etc. cover the majority of requirements on data visualization. There is a special visual element for special cases that supports XAML DataTemplate and makes unique opportunities for realization of display forms of a random view. Different visualization elements and data sources can be linked by means of parameters. It provides data synchronization from different sources. It makes possible to customize flexible data filters, different variants of visual presentation. Necessary settings and data filters can be sent accessing the dashboard from other web-applications by means of parameters. The possibility of writing proper scripts in Python language and their use in setting of context actions for visualization elements enable to set any interaction connections between dashboards and distinct visual elements. You can maximize Ranet Analytics as a central information portal for your organization developing BI-system or integrate it in already existed website under the frame of completing BI tasks (Business Intelligence) and CMP (Corporate Performance Management), integrate in SharePoint. The access to the application provides with URL in simple cases and you can use programmed API for more complicated cases.


