Take advantage of the power of interactive analytics reports
Analytical report templates
Analytical reporting is one of the most important business intelligence tools, providing important, and often critical, information for adapting a company's business development strategy to a competitive market environment. But this does not mean that the creation of analytical reports is the lot of software developers or business analysts who can code algorithms that interpret complex data.
Analytical report templates expand the capabilities and knowledge of all company employees. They are aimed at simplifying analytical reporting through self-service services.
Take advantage of the power of interactive analytics reports.

For various industries and fields of activity, countries and languages
For example, a marketing agency saw in its report that most of the traffic does not come from the source in which the bulk of the promotion budget was invested. Production company: that the terms of payment for completed orders look toward the maximum possible under the terms of the contracts. Public communal services: that the average operating time of pumping equipment has increased. And so on. The scope of analytics is different. All industry specifics are implemented in subject-oriented data marts, but management approaches and practices are usually common.
Сustomizing to the specifics of the industry and field of activity
With interactive analytical reports you will see how ideas for improving management practices arise right in front of your eyes.
Create reports easily
Tired of waiting for IT-specialist to prepare the report you needed yesterday? Tired of wasting time doing ABC/XYZ analysis in Excel?
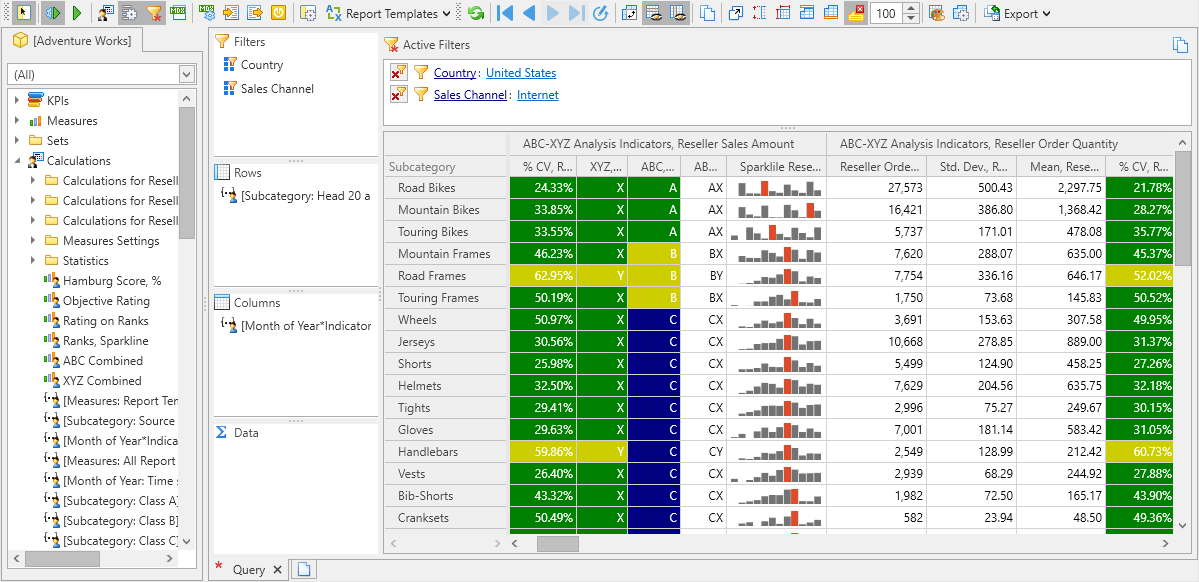
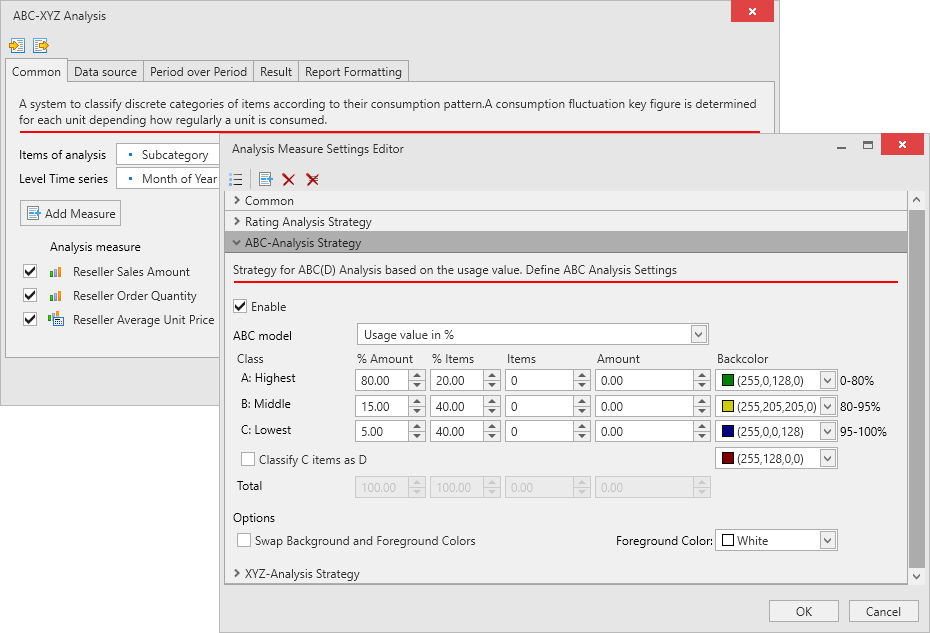
Get a ready-made data analysis tool in one click in the Ranet OLAP Browser PivotTable. With analytics report templates, you are self-reliant and can analyze data faster than ever before. In just a few seconds, you can get a report without writing a single string of code. An ergonomic visual designer allows you to quickly set up report parameters, while a professional report generator software does all the work for you.
Simplicity is in primis

Be in motion
Reports that implement complex analysis methods are no longer static. With the help of templates, they are formed in the PivotTable Designer, the structure of reports becomes much simpler and more consistent. You will get all the information you need, and the dynamism of the pivot table will allow you to change the subject and indicators for real-time analysis.
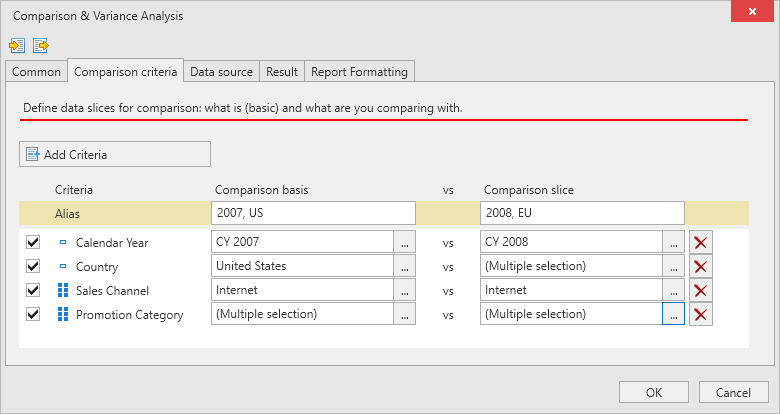
Using filters and drill-down services, you can drill deeper and deeper into the information that is most valuable. Dynamic criteria provide effective tools for comparing indicators across different data slices, facilitate the search for problems, and facilitate the selection of the optimal strategy or alternatives.

Be confident and communicative
It is important for the user to be confident in the system, which means receiving reliable reports in real time. You no longer need to export data to Excel for detailed analysis, adjust and check formulas, being afraid to make a mistake. There is no need to set up styles to render and print the report.
Report templates work according to debugged and tested algorithms, generating data queries that will work quickly and without errors. And support for formatting report cells at the cube level contributes to the perception of information in the pivot table and is preserved when exported to Excel for printing.
A common repository for storing report templates contributes to productive collaboration between users, facilitates the communication of processes, makes work more open, improving the exchange of knowledge and experience.
Modern user interface
The system has an intuitive interface and services that allow the user to feel confident.
Visualization settings provide easy perception of the analysis results.
Reach new heights in professional business intelligence
Easily start your journey to professional business intelligence
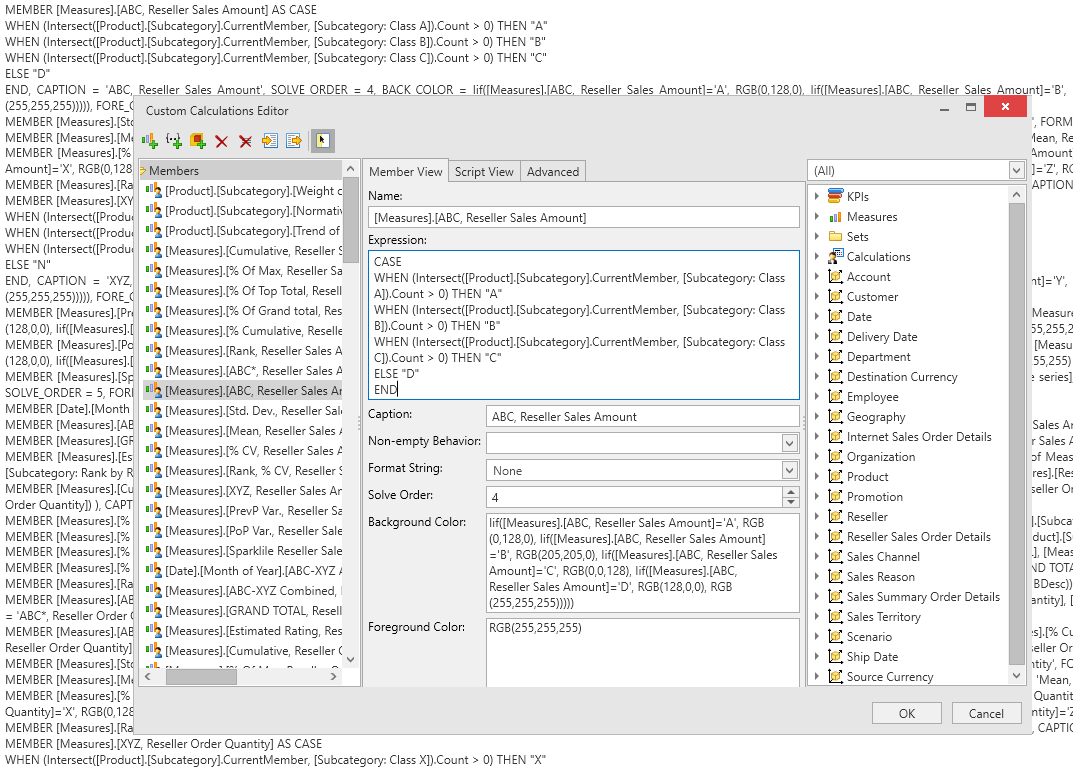
Any user of the system, using the visual Pivot Table Designer and the results of the template report generator, which implements innovative algorithms for creating custom calculations and generating MDX queries, can always customize the report for themselves.
All custom calculations are available in the PivotTable Designer. Therefore, by simply dragging and dropping fields, you can change the structure of the report: analyze individual classification groups or aggregates for them, remove unnecessary ones or add new elements and indicators to the report.
You can modify the report generation algorithms by changing the calculation formulas for custom calculations or even the MDX query as a whole. If you are new to multidimensional business intelligence using the MDX language, you will find it easier to learn by working with data that you are familiar with. If you are an IT professional with good MDX skills, you can discover the ins and outs of working with OLAP data and writing MDX queries.


