
Just consider how much time you spend on the internet daily. My personal answer will be - sometimes too much. In fact, we can perform almost every our daily task there: read news, study, buy things, communicate in social networks, play games, entertain ourselves watching funny videos and memes. But, as you see, lots of these actions are rather useful and one more important thing – we can do business there too.
As you can remember from our previous article, every business nowadays requires additional tools and reporting instruments. Pivot table is definitely the top reporting tool. To be precise, web pivot table is leading now. GalaktikaSoft Ranet OLAP follows the trend for web and provides web-based pivot table component.
Let’s overview what benefits and capabilities Ranet OLAP suggests:
Two pivot table options: Simple vs Dynamic


Ranet OLAP provides variants for both users and developers. Now you can choose your pivot table component option according to your technical skills:
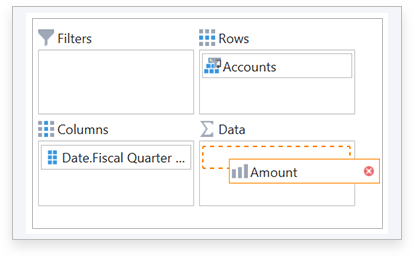
Dynamic pivot table
For users without IT background. Intuitive UI plus dragging and dropping elements option allows creating interactive report without writing a query.
The structure of dynamic pivot table includes:
|
|
Simple pivot table
For developers and IT staff. The central part here is MDX query area. With simple pivot table you can create report of any complexity.
Custom MDX queries enable retrieving and analyzing data slices that can be unavailable otherwise.
So, if you have IT department, you can use MDX queries at full capacity.
Choose version yourself
In our world of diversity, constant movement and mobility, it is rather relevant to have a tool that works on several platforms. Choose your version from Silverlight, WPF or HTML pivot table. Enjoy HTML5, JavaScript, and AngularJS with Bootstrap support or combine support for WPF and Silverlight platforms and quick migration from Silverlight to WPF.

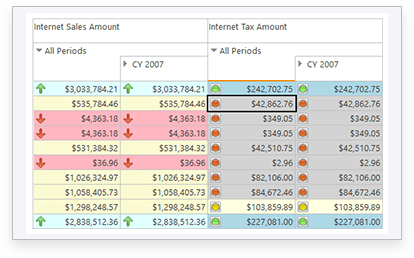
Easy-to-use but interactive
Ranet OLAP presents data extracted from the warehouse in the intuitive form of a pivot table in seconds. You don’t need any special training to work with Ranet OLAP interface as it is easy-to use. In the same time, it is rather interactive. Use filters and graphic extensions, color pivot table cells according you preferences – Ranet OLAP assists you in creating a unique bright report.
Try for free
The best way to understand whether the product suits you perfectly is to try it. As they say - practice makes perfect. Buy it is not so cheap to buy every product in search of your perfect one. That is why GalaktikaSoft offers free 30-day trial for Ranet OLAP. Also, demo version available. You can try first and make sure our web-based pivot tables are useful in practice.

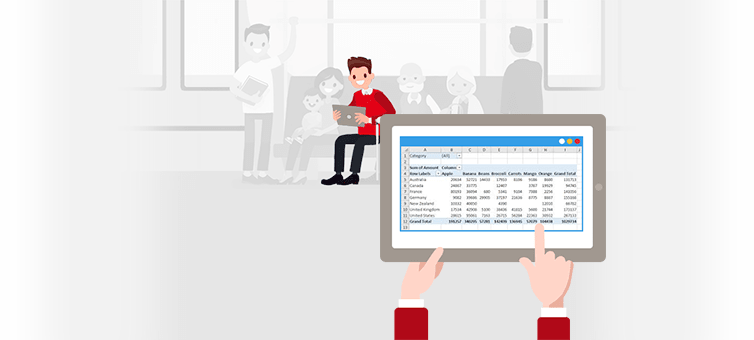
Mobility
Web base allows you to work with Ranet OLAP web pivot tables wherever in the world you are. Make reports and share them with your colleagues online. There are no boundaries for your business now!
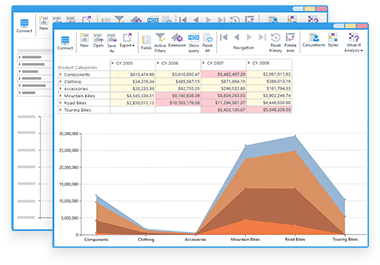
Pivot table designer: pleasant work with huge data amounts
Our pivot table designer is a core instrument for reports operation. Analyze your data from different points of view with a help of:
- geographic maps;
- cool business graphics;
- pivot charts;
- five active panels.
Drill up and drill down buttons simplify endless values columns analysis.
Wide reporting capability
Being easy-to-use, Ranet OLAP pivot table provides users with rich functionality:
- Unique - you can save your personal report layout settings and use them for future work;
- Simple – just drag and drop elements from OLAP cube browser to the selection panel and create ad-hoc reports;
- Creative – built-in graphic tools allows you to underline and color the most important aspects and put accents yourself.
Become one of our client and experience all Ranet OLAP benefits yourself!
