

- Pivot Table: definition, history and usage
- Web pivot table and its features
- Reasons to use web pivot table
- Ranet OLAP Pivot Tables
What is the best way to analyze data? That’s right – make regular reports. It is the simplest and efficient tool to see results and forecast future opportunities. In modern business world, every company stores huge amounts of data that requires analysis. That is why we need a tool for fast, simple and interactive analysis. Pivot table is one of them.
Pivot Table: definition, history and usage

What is it?
So well, first of all, pivot table is a tool for data analysis and summarizing. To be precise, the summary we are talking about usually includes different statistics, sum, and pivot table’s aim is to group this data together in consequential way. It helps to point out the most relevant information and focus on it.
When was it generated?
The first step of pivot table creation was made by Lotus Development in 1991. The company released Lotus Improv, a program to store data and define different categories. Thus, Improve became the first model of modern pivot table. The next step was made by Microsoft Windows, when they released their own Improv version in 1993. And thus, in 1994 Microsoft Excel 5 appeared with a new functionality called “pivot table”.
When to use?
Pivot table, as we already mentioned, are the most helpful when we need to analyze complex data in huge amount. With a pivot table you can:
- Explore
- Analyze
- Summarize
- Rotate your data.
It is especially useful when working with several dimensions in the table. It provides you with capability to sort, filter, detail the certain options.
One of the most popular and useful pivot table vendor is Excel. It is a really great data analysis tool to start with. Such programs are installed on computer, require license purchase and upgrades. We think you agree: mobility is limited here. But, there is another option nowadays – web-based pivot tables. Follow the next paragraph and learn more.
Web pivot table and its features
Primarily, ask yourself is it convenient to:
- Manage and load data on the fly;
- Create reports according your requirements;
- Always have real-time access to your data;
- Make interactive reports;
- Share reports, data and templates online and have access to it on any device.
Probably, the answer is ‘of course, yes’. And here web-based pivot table comes into play.
Web-based pivot tables run inside browsers instead being stored in computers. After installment on server, pivot tables are accessible from any device through browser. Updates are also made on the server so users don’t have to deal with these issues.
Web-based pivot table usually has the following features:
- Possibility to generate report by multidimensional data source;
- Different sorting criteria;
- Interactive pivot charts;
- Real-time data access;
- Opportunity to share reports online.
Reasons to use web pivot table

In order to prove the advantages of web-based pivot table use let’s overview some of its core benefits.
1. Easy-to-use
UI of web pivot tables usually is very intuitive. So it is not so hard to learn all its functions and controls without additional help. Become a data analyst yourself and create reports easily with drag and drop functions.
2. Share reports and templates online
Any report can be saved for the future template or as ready one. Another useful benefit is that you can share your results with your team online. The productivity grows as with a ready template you and your colleagues don’t have to spend time while creating a new similar report.
3. Mobility
One of the keys for business success is mobility. Modern devices made our life easier and it really helps if they can bring this mobility into business too. Web-based pivot tables allow analyzing data anywhere you are through any device. Thus, there are no boundaries for work.
4. Personal adaptation
Choose the suitable color, filters and categories for you personally. You can adjust pivot table data for you starting from sell color to filters’ number. Point out the most important information yourself.
5. Quick decision making
It is also about sharing but a bit in different way. This feature also boosts staff cooperation and productivity as you can discuss your report and correct it quickly. Make decisions together with your team and boost company productivity with quick online reports sharing.
So which tools do we need to get all these benefits? As we already mentioned the most popular and widespread pivot table tool is Microsoft Excel. But there are some other options. One of them is Ranet OLAP.
Ranet OLAP Pivot Tables
GalaktikaSoft presents data analysis and reporting tool Ranet OLAP. It was created specifically to ease the work with multidimensional data. It includes more than 50 visual elements and controls for comprehensive business data analysis.
Using Ranet OLAP you obtain the following benefits:
- Information presented in convenient intuitive form;
- Easy to use without additional IT help;
- Integration into other systems and extension are available;
- Graphic designer and tools allow creating bright informative reports.
Being a set of UI controls Ranet OLAP also includes Pivot Tables. And what is more important their both available on HTML, WPF and Silverlight. There are two variants of pivot table controls:
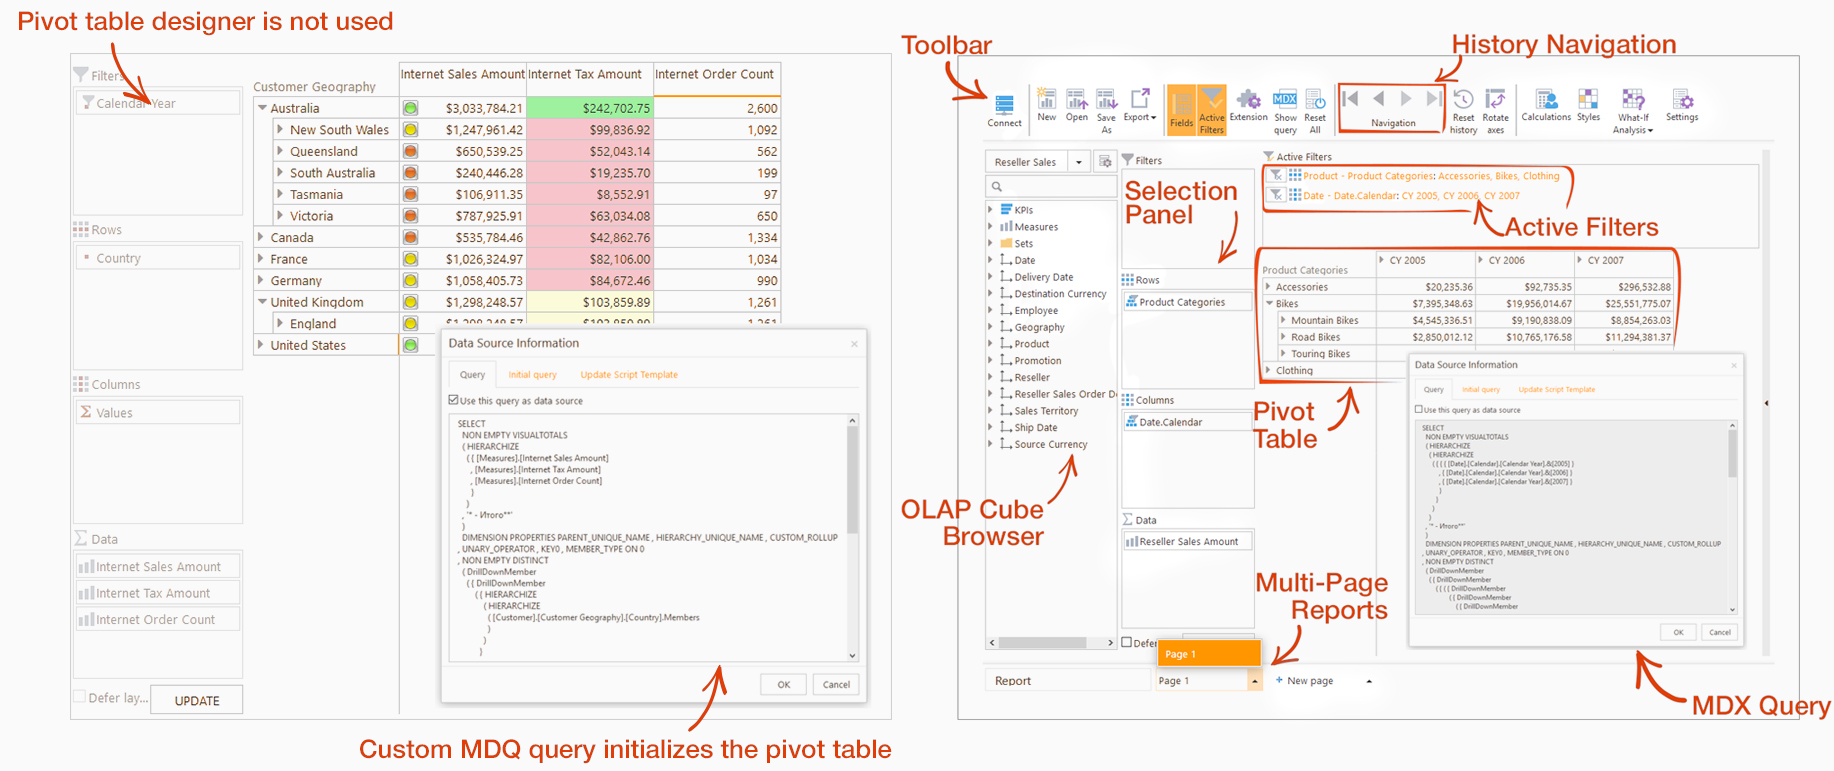
| Dynamic pivot table | Simple pivot table |
| This control allows creating interactive report simply dragging and dropping elements in the designer area of a pivot table. The structure of dynamic pivot table includes:
The key feature here is that there is no need to deal with MDX queries generation as the system cares about it. So this pivot table is the best variant for users without technical background. | The second option is a simple pivot table. This control doesn’t use pivot table designer. The work is focused on MDX query area. Simple pivot table allows generating more complex queries and unique reports. So if you have IT staff or technical knowledge this variant suits you best. |
It is not so easy nowadays to choose the right business tool among huge variety on the market. You’ll never know till try it yourself. That is why GalaktikaSoft offers Ranet OLAP free 30-day trial and demo version. Try first without paying and make sure yourself.
