
Traditional analytics
Ranet Analytics gives the services providing the workers of your organization with Business Intelligence (BI) instruments which allow the workers to make reasoned decisions.
The main task of the dashboard is to provide the visual presentation of information about some aspects of the business, give the resources for its interactive analysis, simplify for a user the search of dynamically changing information which is necessary for making decisions and as a result help you to trace and estimate the effectiveness of your organization.
Information on the dashboard can be displayed in the form of index dials, diagrams and graphs, tables and other visual elements. All the elements of data visualization on the dashboard are interactive that allows a user to interact with the original data effectively. Support of the parameters allows rebuilding the dashboards and data dynamically in dependence on the user choice.
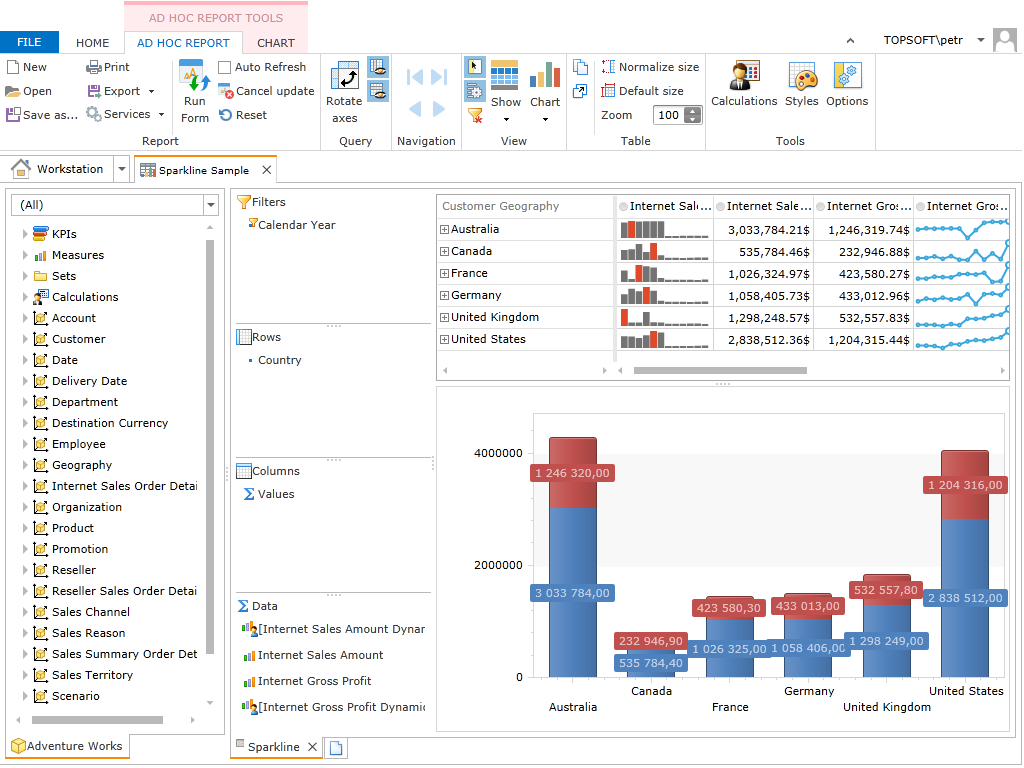
One of the main analysis instruments is Ad hoc Reports that allow analyzing random views of data in different forms using summary tables and instruments of business graphic arts. They are noted for simplicity of use and intuitively understandable interface. In case of necessity a qualified user can create computational indicators and use different analytical functions provided with MDX language in computations.
The possibility of using the system via the web in any place, in any time and on almost any device is the possibility for users timely solve manufacturing tasks and combined use of the solution within the organization allows the users of the system exchange knowledge and experience, that makes their work more effective. Timely delivery of new critically important business information can have a tremendous effect and change the course of the company.
The main functional resources of analysis
- Interactive analytical dashboards;
- Express-reports (analytical OLAP-reports);
- Services of detailing for data navigation;
- Dynamic evolution and interaction of reports in dependence on the user choice;
- Developed business graphic arts;
- Embedding of computational indicators;
- Conditional format, sorting and filtration of data;
- Export of data from the source to Microsoft Excel;
- Work of business users through web interface and on mobile devices.
These Runtime services are services of BI-system business users.
