Ranet OLAP DYNAMIC PIVOT TABLE control
HTML, WPF
Ranet OLAP Dynamic Pivot Table control allows creating interactive reports by simply dragging and dropping elements in the pivot table designer area, without the need to write custom MDX queries.
The reports are automatically generated and updated once elements are added to (deleted from) the designer area, and do not require any additional actions from the user’s side. Thus, the control allows those users that have no experience with MDX or have never worked with BI software to start working with pivot tables quickly. This way of MDX query generation is the main difference between the Dynamic pivot table and Simple pivot table controls.
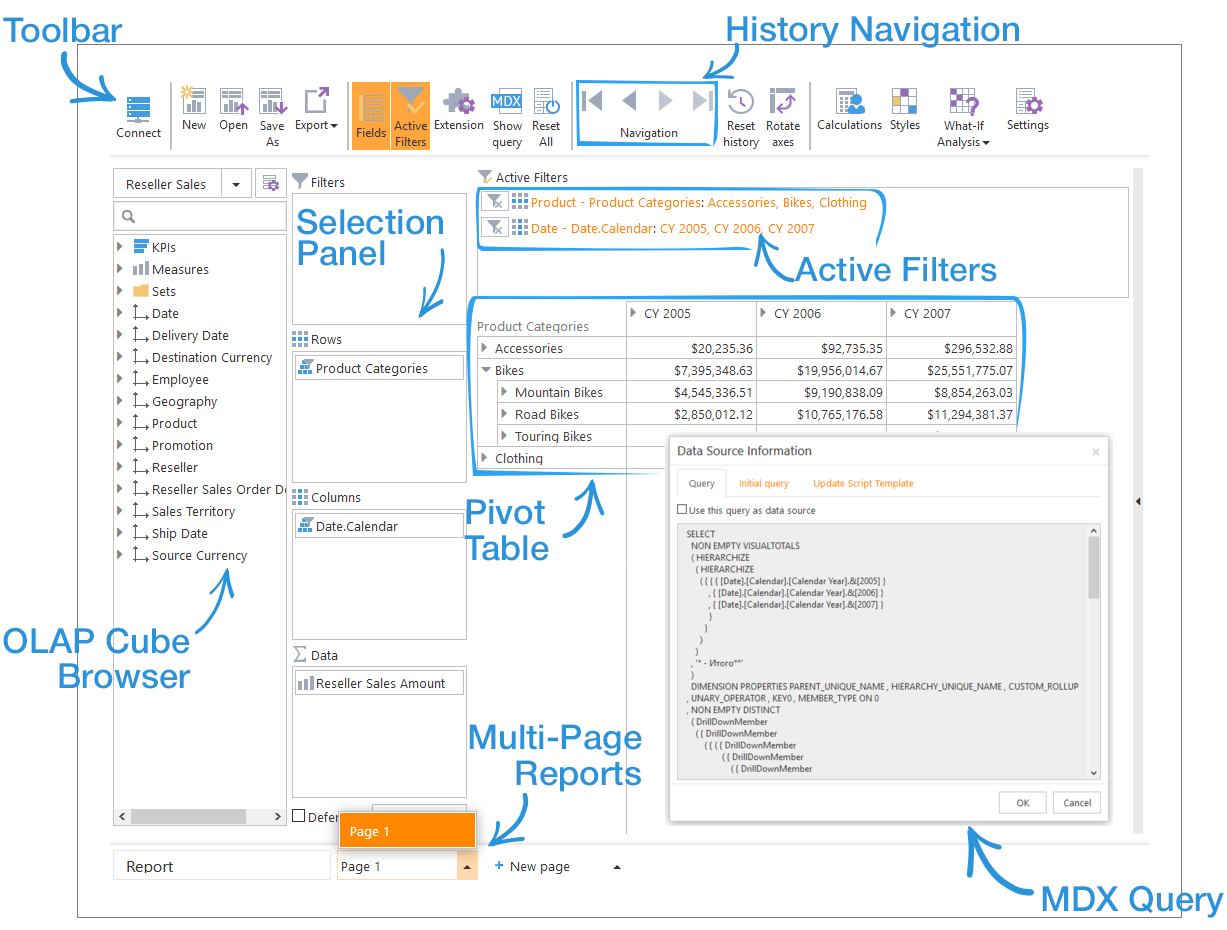
Dynamic Pivot Table Structure
Ranet OLAP Dynamic Pivot Table control consists of pivot table designer and the pivot table itself. In general, we can single out six main areas, which are actively used when creating a report and which can be hidden/shown depending on the control settings.
Toolbar
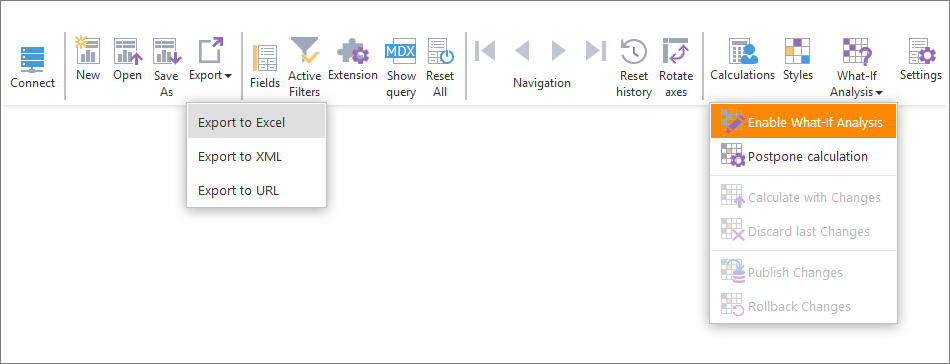
Toolbar contains all frequently used commands that manage the dynamic pivot table control. The commands are represented in the form of simple buttons, toggle buttons, and split buttons that are grouped according to their purpose and functionality.

WPF
HTML
Olap Cube Browser
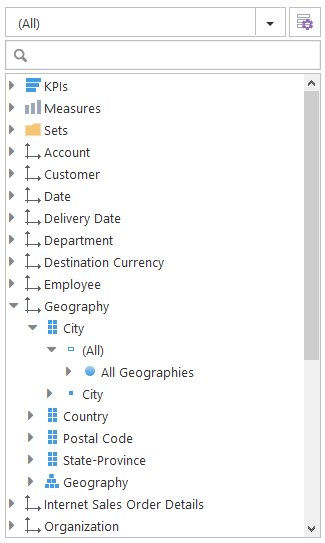
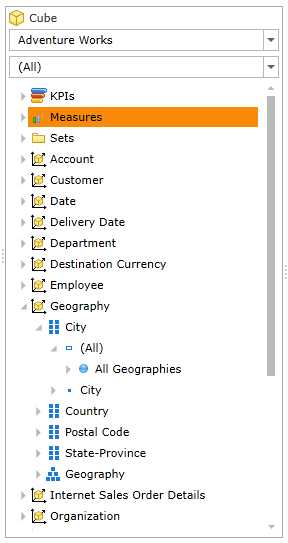
Olap Cube Browser contains cube metadata that users can add as fields to the pivot table. The metadata has a tree-like structure that makes it more user-friendly allowing the users to better navigate through the cube data and quickly find the elements they need. The elements in the OLAP Cube Browser include dimensions, hierarchies, hierarchy levels, KPIs etc.
HTML
WPF
Selection Panel
The area consists of four containers that define the structure of the future pivot table and filters applied to it. The user fills in the containers by dragging and dropping data elements from the OLAP Cube Browser. It automatically generates an MDX query, which initializes a pivot table.
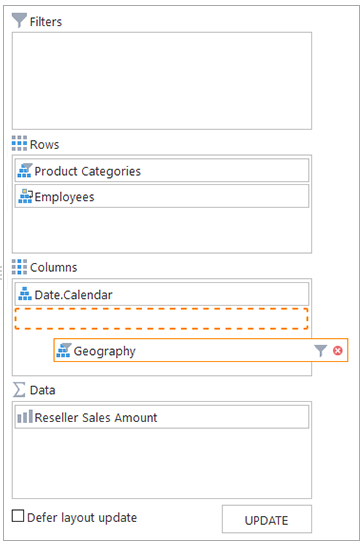
HTML
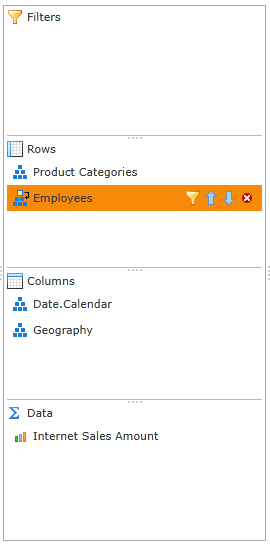
WPF
MDX Query Area
The MDX Query Area shows the MDX query that is used for initializing the pivot table. Dynamic Pivot Table can work in two modes:
- Design mode (default), when the MDX query is generated automatically according to the design area settings.
- Custom Query mode, which uses a custom MDX query that was created by the user and cannot be modified through the Selection Panel (the Selection Panel is unavailable for editing in this mode).
Active Filters
The area contains a detailed description of filters applied to the pivot table in the form of hyperlinks. It lets users see which filters are applied to which data in the pivot table, edit/delete them, and export them to MS Excel or XML.

HTML

WPF
Pivot Table
As a part of the Dynamic Pivot Table control, the pivot table area shows the result of the MDX query as a table (by default) and/or a heat map/chart. It can be used separately from the pivot table designer and work directly with the MDX query. In this case, it serves as a Simple Pivot Table control.
Pivot Table Design and Navigation
Dynamic Pivot Table allows recording the design and navigation history that includes:
- all changes in the report’s structure, when the user drags the elements from the OLAP Cube Browser to the Selection Panel, changes their order in the Selection Panel, deletes them from the Selection Panel;
- all user manipulations in the pivot table/chart/heat map, such as expand/drilldown/drilldown by, etc;
- all changes in the pivot table design.
All actions and states recorded in the history can be invoked later. A user can go forth and back in the navigation history using the commands on the Toolbar.

It can significantly simplify user’s work with the pivot table, especially if there is a large number of nodes the user has to manage.
Ranet OLAP Dynamic Pivot Table control provides opportunities to work with multi-page reports (report packets/books), where every page will have its own design settings, selection panel elements, custom calculations, cell styles etc.
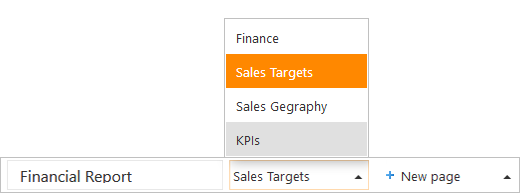
This makes it perfect for analysis of a large amount of related information.
Try For Free
You can download a 30-day trial of Ranet OLAP and try the functionality of the Dynamic Pivot Table control for free.

