Ranet OLAP KPI Viewer Control
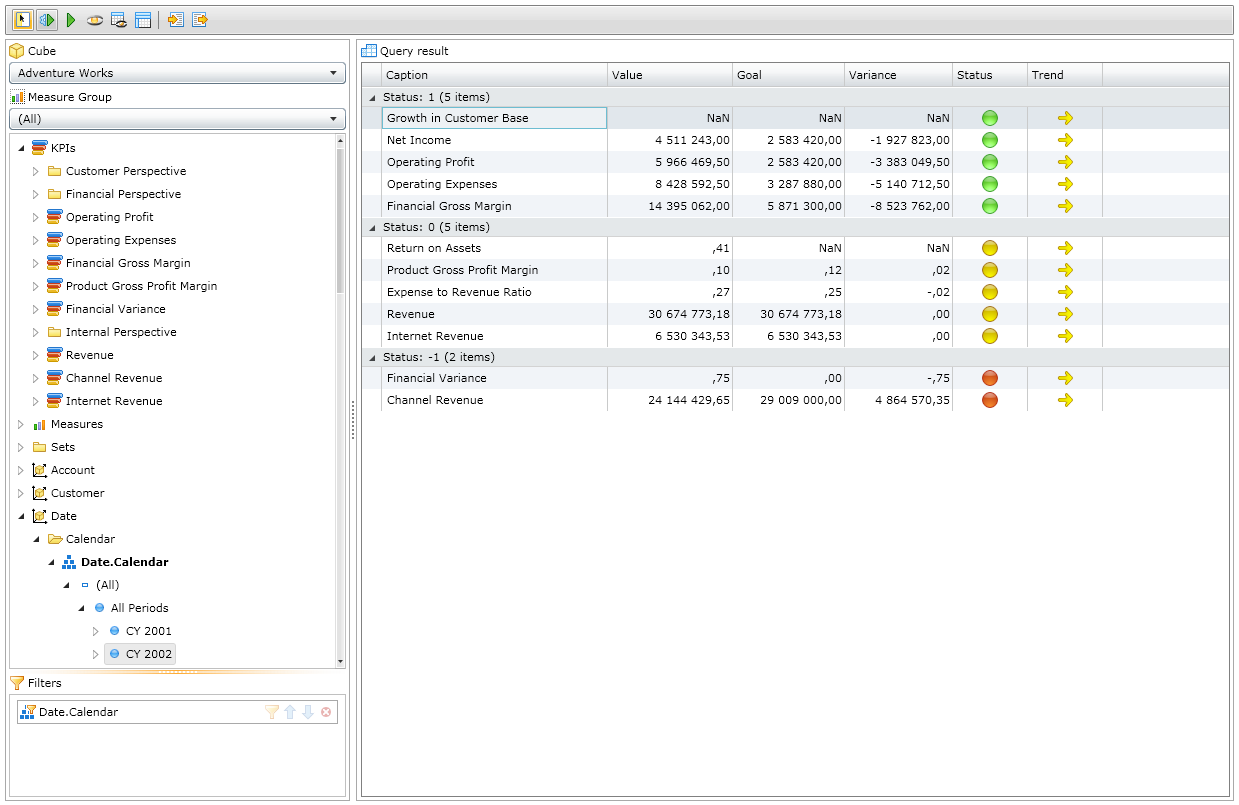
The KPI Viewer control shows Key Performance Indicators (KPI) defined in the cube and their basic values at a certain time. The basic values are:
- Target KPI value (Goal)
- Actual KPI value (Value)
- KPI Status (Status). The KPI status indicator shows the user, how the actual KPI value can be interpreted: inadequate (low), acceptable (medium), or good (high).
- KPI change trend in time (Trend). The trend indicator shows whether the KPI is improving, or deteriorating, or stays stable in time.
It is possible to drag and drop the cube KPIs to the result viewing area. In so doing, an MDX query that returns the KPI values in columns based on the determined filters is generated automatically. It is possible to group KPIs by value in a certain column, and the user can control the list of mandatory columns.

The KPI Viewer control is comprised of the following areas:
- Toolbar
- Report Designer Area. It is used for designing a query
- KPI Grid Area. It is the KPI table showing the query results
The KPI Viewer toolbar includes commands:
| Command | Description |
| Show/Hide query designer | Show/hide the query designer. |
| Run MDX query automatic | Run the MDX query automatically. |
| Apply | Runs the current MDX query and shows the result. |
| Show All | Displays all cube KPIs in the query result display area. If the command was not activated, the user can select the required KPIs on his own, by dragging and dropping them to the result display area. |
| Customize columns visibility | It allows selecting columns to be displayed in the table. |
| Customize columns grouping | It allows grouping KPIs by the value in a certain column. |
| Import query layout setting | Imports query settings from an XML file. |
| Export query layout setting | Exports the query settings to an XML file. |

