
Ranet OLAP MDX Designer Control
Ranet OLAP MDX Designer control helps to create interactive reports based on Microsoft Analysis Services OLAP cube data. The reports can be simple or complex, depending on the user’s skills. MDX query area serves for displaying the MDX query in the pivot table designer. According to the MDX designer mode, the query can be generated automatically under the setting of the report structure in the Report Designer or edited by the user manually.
MDX Designer allows viewing cube metadata and creating an MDX query by dragging and dropping cube metadata description elements to the filter areas, columns, rows, and data. One can use cube dimensions, levels, hierarchies, and cube measures when creating an MDX query. The cube metadata used for the query is shown in bold.
While analyzing the data MDX query from the pivot table designer is transmitted as a parameter to initialize the pivot table. In the pivot table the MDX query is parsed if necessary and is modified. For instance, the history of the user’s commands is restored in order to restore the latest saved pivot table state or the properties settings ‘Hide empty Rows/Columns’ are processed.
It is possible to copy settings across areas and group settings in certain order, thus forming CrossJoins for rows and columns and embedded cubes.
MDX designer modes
MDX designer is available both to users without IT skills and to professional analysts who are used to generating MDX queries by hand. According to the skills and qualification, MDX designer supports two operation modes.
- Design mode is set by default. In this mode MDX query is generated automatically under the design area field configured.
- Custom Query mode exploits a custom MDX query which can be created by hand and is not changed by the system. In this mode the selection panel is not available to be altered.
OLAP expects the MDX query to be created by the user (a programmer, a cube administrator, an analyst) single-handedly or copied from another application. It provides an opportunity to use the whole capacity of the MDX language so that to gain the most efficient solution for the report generation.
The modes define the rules of the MDX query access to the OLAP data source.
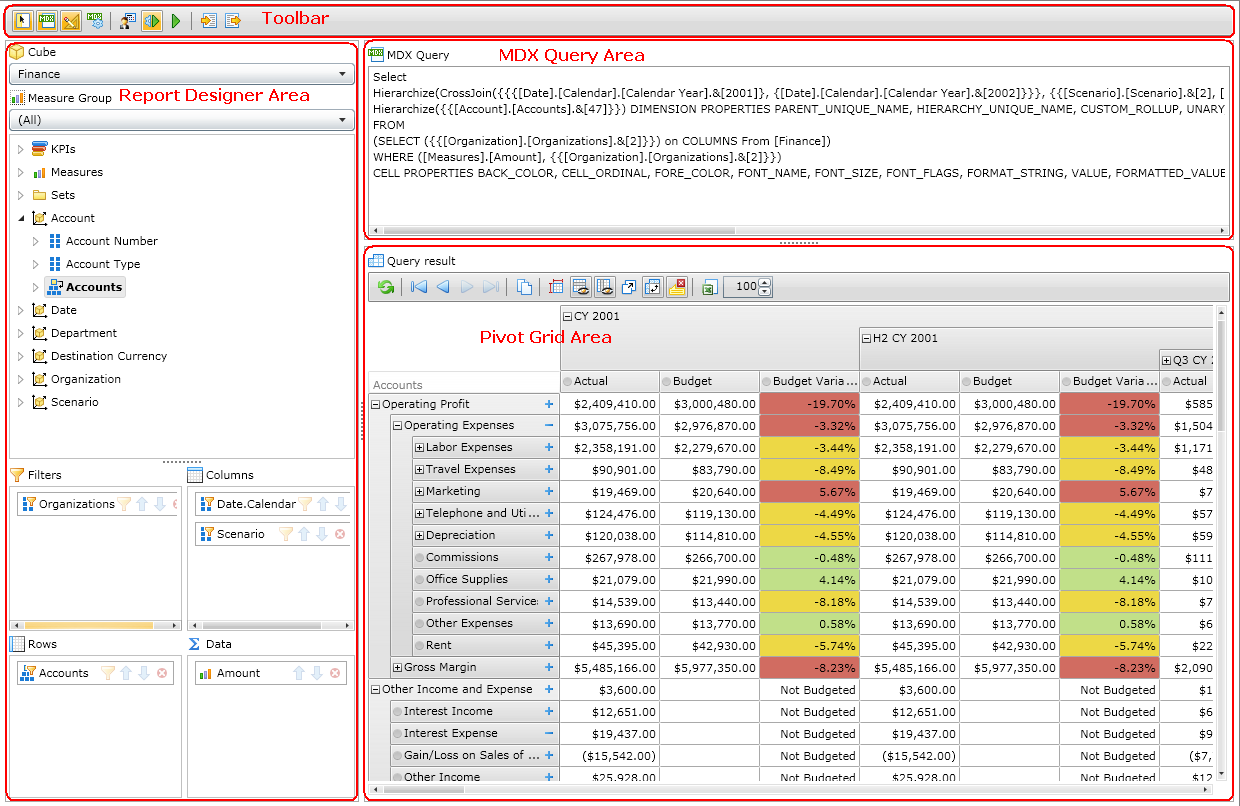
The MDX Designer has the following areas:
- Toolbar
- Report Designer Area
- MDX Query Area
- Pivot Grid Area, summary table showing the result of the query
MDX Designer areas
Report Designer Area

Report designer area helps the user to build an interactive report by dragging and dropping cube metadata description elements to the filter areas, rows, and columns of the summary table.
Any dimensions, dimension hierarchies, hierarchy levels, and cube measures can be used in the report. In this case, they are highlighted with bold font in the metadata description. The user can setup a filter for a group of measures for metadata descriptions, in order to limit the cube area used for designing the report.
The dimension hierarchies included in the rows and columns area form a cross product of their members. The Crossjoin function of the MDX language is used for this. In so doing, it is possible to limit the list of hierarchy dimension elements by setting up filters. The sequence of corteges in the resulting set will determine the order of dimension hierarchies.
The commands shown in the table below are user for detailed setup of reports and MDX queries.
| Command | Description |
| Move up | Moves the dimension to a higher level in the cortege |
| Move down | Moves the dimension to a lower level in the cortege |
| Remove Field | Removes the dimension from the report configuration and the MDX query configuration |
| Change Filter | Calls a filters setup dialog allowing to modify the filter where a list of elements included in the report is determined |
Toolbar
The toolbar is MDX Designer area that is used to control the dynamic summary table. The toolbar includes commands that control the report generation rules and MDX query generation rules.
| Command | Description |
| Show/Hide query designer | Shows or hides MDX query designer area |
| Show/Hide MDX query | Shows or hides MDX query area |
| Edit MDX query | Allows manual editing of the query |
| Generate MDX | Generates an MDX query based on the current settings determined in the designer. A manually edited query will be lost |
| Customer Calculation Editor | Invokes a customer calculation editor dialog |
| Run MDX query automatic | Automatically runs the MDX query after each user’s change in the designer |
| Execute MDX query | Runs the current MDX query and shows the result |
| Import query layout setting | Imports query settings from an XML file |
| Export query layout setting | Exports the query settings to an XML file |
By default, a change of the settings in the designer would automatically change the MDX query and generate a report based on the query.
MDX Query Area
MDX query area is designed for viewing and editing the MDX query. The query is generated automatically after changing the settings in the designer. If the user has sufficient skills, they can modify the MDX manually and use all capabilities of the MDX query language in order to achieve the most efficient solution. It is possible to save the edited query in order to invoke it later.
Pivot Grid Area
Description of the Pivot Grid Area is given in the Pivot Grid section.
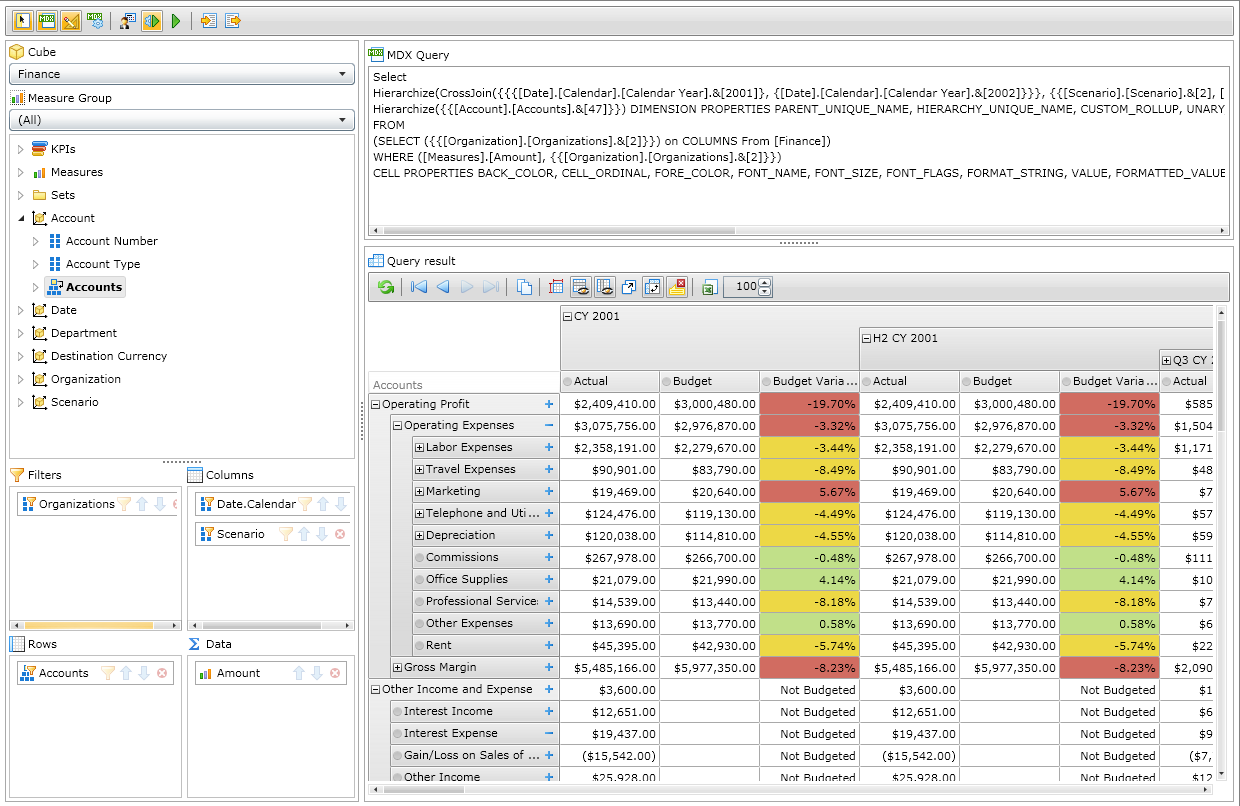
MDX Designer interface
MDX designer interface is provided to the end-user as several areas (panels) some of which can be hidden during the first initialiяation. MDX pivot table designer includes five main areas which are actively utilized by the end-users while generating interactive ad-hoc reports:
- Toolbar contains icons with the commands used for the pivot table design, view, and data management.
- Cube Browser displays the cube metadata and data which can be used to create the fields structure in the pivot table.
- Selection Panel displays the fields structure settings in the pivot table.
- Active Filters display the content and the description of the filters for the data in the pivot table.
- PivotTable displays the result of the MDX query execution.
Four fields areas to set up the table
Each area is an interactive container where a user can add entities from the cube browser in order to customize the MDX query and the pivot table itself.
- Filters represent fields shortcuts to dimensions/hierarchies/levels which enable users to set up filters for the cube data by manual selection of the concrete elements in the dimension hierarchy. Filters settings limit the cube data slice for analysis.
- Rows represent fields shortcuts to dimensions/hierarchies/levels which enable users to generate the structure of reports fields which will be displayed in the row area of the pivot table. Users can change the order of the shortcuts placement in the container by dragging them up and down hence altering the order of fields sequence in the report. It’s possible to remove or add a new entity from the cube browser. Users are able to set the filters by manual selection of the concrete elements in the dimension hierarchy or set the program filters. Filters settings limit the cube data slice for analysis.
- Columns represent fields shortcuts to dimensions/hierarchies/levels which enable users to generate the structure of reports fields which will be displayed in the column area (header) of the pivot table. The same capacities as in the Rows are available to the users.
- Data contains shortcuts to indicators. These are the elements from the measures dimensions, KPI values, custom calculated indicators. If there are two or more indicators in the settings area they can be displayed both in the rows area (right sidebar) and in the columns area (upper bar) of the pivot table. An automatically created shortcut Values indicates in which exact area the indicators will be displayed. The users are able to drag the shortcut Values across the areas of Rows and Columns.
