

What is OLAP (Online Analytical Processing)?
OLAP definition
Acronym OLAP stands for Online Analytical Processing, a computer processing technology that allows rapid execution of complex analytical queries. It is an important part of business intelligence, providing powerful capabilities for data mining and trend analysis.
You can often meet terms OLAP and Multidimensional data analysis together, but actually, they are interchangeable. Online analytical processing technology represents the data in a multidimensional structure. It allows the users to consolidate, detail and rotate data in order to see and analyze it from various perspectives. This multidimensional database structure helps processing ad hoc queries rapidly, which makes OLAP tools a popular choice for business reporting.
One of data search concepts are commonly associated with OLAP is data mining. These two terms are usually considered as synonyms, however there is a clear difference. The major difference between OLAP and data mining lies in their purpose: they solve different analytic problems. OLAP is a tool that enables users to make forecasting and data summarization. Data mining, in its turn, discovers hidden patterns in data. In fact, data mining is more than OLAP.
Short history of OLAP
We are going to begin introduction to technology with its history. The term OLAP, as opposed to OLTP, was coined by Edgar Codd in 1993 in his article in Computerworld magazine where he outlined the 12 rules for OLAP software. Although the article was later retracted by the magazine due to a potential conflict of interests, its influence on shaping up the OLAP technology is undeniable. In 1995, Nigel Pendse defied the FASMI (Fast Analysis of Shared Multidimensional Information) requirements for analytical processing tools.
The history of the technology itself dates back to 1970 when Information Resources released Express, the first OLAP server. Oracle bought it in 1995 and Express subsequently became the basis of Oracle OLAP, a multidimensional calculation engine that Oracle provides within its database.
In 1992, Arbor Software (acquired by Oracle in 2007) released another prominent OLAP product, Essbase. Microsoft released its OLAP server, MS Analysis Services, in 1998. It contributed to the popularity of the technology and prompted the development of other OLAP products.
Is OLAP still relevant? The answer is of course, yes, demand for OLAP continues to grow nowadays even more.
OLAP system overview

Let’s focus on elements of an OLAP system now.
OLAP cube
The basic element of OLAP system architecture is OLAP cube. The data in the cube has an organization using either a star or a snowflake schema. At the center of snowflake there is a fact table that contains aggregations (measures). Fact table is connected to a number of dimension tables containing information about the measures.
Dimensions describe how to analyzy measures. If the cube contains more than three dimensions it is often referred to as a hypercube. One of the main features belonging to the OLAP cube is its static character. It implies that it is impossible to change the cube after development. Hence the process of cube build and data model setting is a crucial step on the way to appropriate data processing in the OLAP architecture.
Data aggregation
As mentioned above, at the center of the cube structure there is a fact table containing aggregations. Using aggregations is the main reason why OLAP tools proceed queries a lot faster in comparison with OLTP.
Aggregations are summaries of data that have been pre-calculated during the data processing. All members stored in the dimension tables define the queries that the cube can receive. Aggregations answer these queries before their generation. In the cube, aggregations are stored in the cells whose coordinates particular dimensions specify. The number of aggregations the cube might contain depends on all possible combinations of dimension members.
Multidimensional data structure
To better understand Online Analytical Processing system, it is important to touch upon OLAP data structure. One of the main characteristics of this system is the multidimensional data structure. The data structure works in the following way:
A cube can have multiple dimensions.
↓
The combination of dimension members defined in the query point to a specific cell that contains an aggregated value. That allows the system to process queries almost instantaneously.
↓
The multidimensional structure also allows viewing the data from multiple angles.
↓
All this makes OLAP databases especially popular for data analysis and BI applications.
OLAP in data warehouse architecture
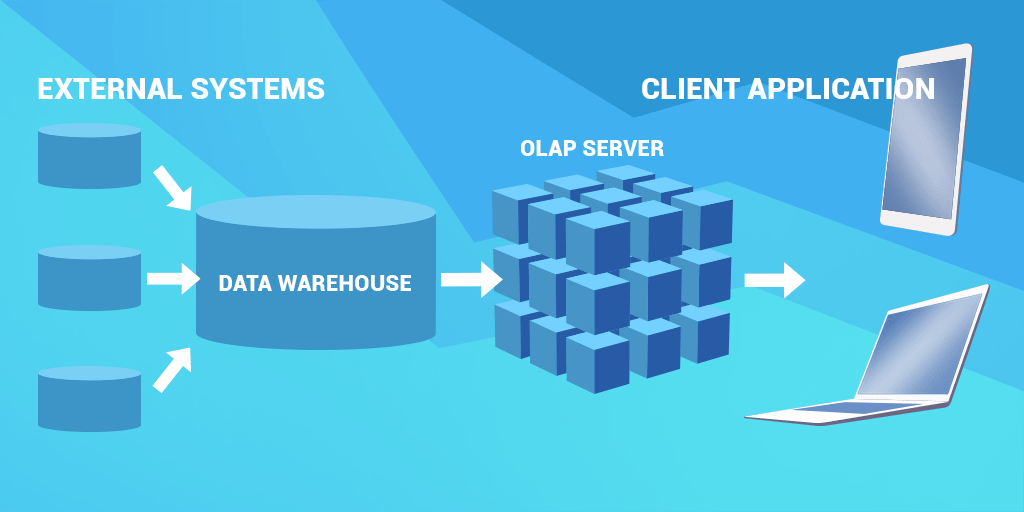
Let's try to explain OLAP architecture diagram you see above. One of the core components in OLAP technology is OLAP server. In the traditional three-tier data warehouse architecture, it occupies the middle tire, between the database server and the client-side OLAP tool. Besides aggregating and pre-computing the data from the relational database, it provides advanced calculation and write-back options, additional functions that extend the basic possibilities of the query languages, and other features.
For better understanding, we illustrated how it works in OLAP diagram above.
The leading OLAP software vendors to date are Microsoft, Oracle, IBM, SAP, and others.
Types of OLAP
There are different types of OLAP models that vary in the way the data is stored, the way access to the data is organized, etc. We can distinguish three main online analytical processing models:
ROLAP
Relational OLAP, or ROLAP, stores all data, including aggregations, in relational databases rather than cubes, and doesn’t use pre-computation. ROLAP works with SQL tools that send queries directly to the relational database. However, SQL tools do it in a way that creates an appearance of OLAP operations such as slicing, dicing, and drill down.
This approach is the best option for enterprises with large data warehouses. It heppens for three main reasons:
- offers better scalability;
- short load times;
- it is good at processing text information. However, the relational database needs specifical design (an OLTP database won’t do), SQL doesn’t support a lot of complex calculations, and it is often requires to create aggregate tables to improve query execution. Overall, ROLAP tools usually have lower performance than those on MOLAP base.
MOLAP
Multidimensional online analytical processing (MOLAP) is the traditional OLAP model. All data, including aggregations, is stored in multidimensional data cubes. The data in the cubes is pre-computed, which ensures fast query performance.
The multidimensional model makes it easier to locate cells in a cube than in a table, which, along with powerful techniques and calculation algorithms, allows retrieving and analyzing data significantly faster than when working with relational databases.
At the same time, since the data in the cubes is pre-calculated and thus harder to update, such systems are not very scalable. Besides, transferring data from a relational database to a MOLAP engine can lead to data redundancy.
HOLAP
Hybrid OLAP (HOLAP) combines features of the two previous approaches in order to provide fast query processing in combination with high scalability. In this OLAP data model, a relational database and multidimensional cubes divide the data. There are two approaches as to how to divide the data:
- Horizontal partitioning implies that some data slices that require faster query processing are stored in MOLAP. And ROLAP stores the others;
- In the vertical partitioning, aggregations are stored in MOLAP and detailed data – in ROLAP.
Major vendors now support this approach in one form or another.
Other types
There are four more OLAP models we want to touch upon:
DOLAP
Desktop OLAP, or DOLAP, implies that users can download a part of the cube on their computer and work with the data locally. The main advantage of such applications is that they are easy and cheap to deploy and maintain. The biggest drawback, however, is their very limited functionality.
WOLAP
WOLAP includes web-based online analytical processing tools that do not provide options for data download or local access to data. Such solutions have low deployment cost as all the client needs is Internet connection and a web browser. However, just as desktop OLAP, they have limited functionality. Besides, all major providers now offer web-only access to data as a feature of their much broader solutions.
RTOLAP
The main feature of Real-Time OLAP (ROLAP) is that aggregations are not stored in relational tables or cubes, but are calculated in-memory during the query execution.
DMR
This term is frequently meets in the context DMR vs OLAP. However, Dimensional modeling of relational data source (the full for DMR) is a form of ROLAP. DMR includes the representation of relational data sources using OLAP cubes, therefore DMR is closely related to the latter. DRM also uses MDX-based queries that promotes powerful analysis. It helps organizations to get a reliable and effective solution for tracking various aspects of a particular business, including profitability portfolios, cost analysis and anomalies analysis and business fraud.
OLAP vs. OLTP
Online analytical processing was created due to the inability of OLTP systems to process complex queries fast enough (OLTP stands for online transactional processing). Since then, the two technologies have been contrasted to each other constantly. Here is a short overview of the main differences between OLAP and OLTP tools.
| Difference: | OLAP | OLTP |
| Queries | Works with a relatively small amount of very complicated read-only queries | OLTP processes a large volume of simple queries of different kinds, such as insert, update, read, and delete queries. |
| Users | Tools of OLAP are mainly used by data analysts, managers and decision-makers. | These systems are used by database administrators and IT professionals. |
| Data | OLAP uses consolidated historical data organized according to a star schema or a snowflake schema. OLAP data updates rarely and the updating process takes a lot of time. | OLPT uses operational data stored in many tables. System's data updates regularly and fast. |
| Data representation | Multidimensional. | Flat two-dimensional. |
| Size of the database | As OLAP databases have to store consolidated data, they are significantly larger than OLTP ones, containing millions of record and occupying up to 1 TB as opposed to thousands of records and the size of up to 1 GB of the OLTP databases. | |
| Purpose | The main purpose of OLAP is data analysis and business intelligence operations scaffolding planning, problem-solving and decision-making processes in the company. | OLTP is used for running and controlling ongoing business tasks. |
OLAP Operations
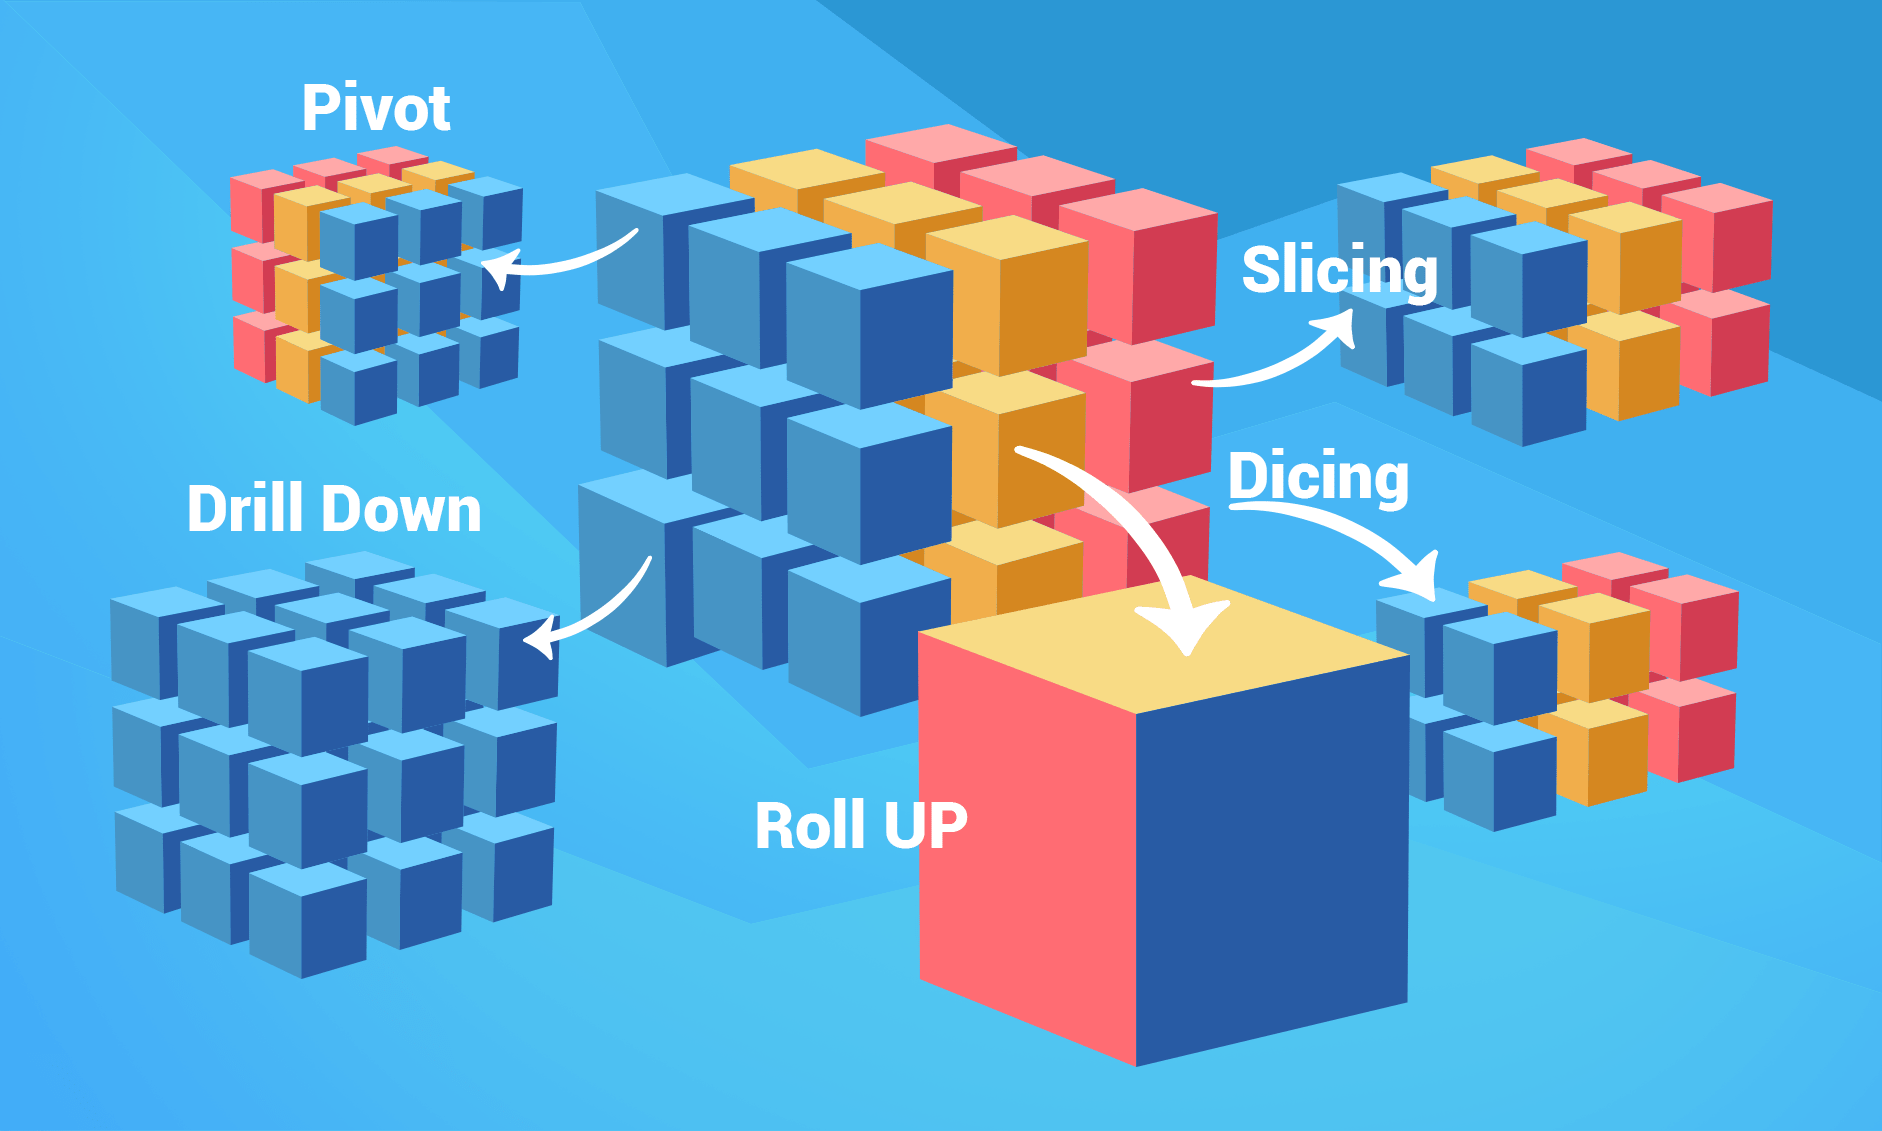
The data in cubes is organized in dimensions that consist of hierarchies of multiple levels. Such data structure lays down the foundation for operations of online analytical processing tools that facilitate data analysis. The main OLAP operations include: roll up, drill down, slice, dice, and pivot.
Roll Up
Roll Up is the aggregation of data along a hierarchy of a cube dimension. When Roll Up is performed, the data is aggregated by ascending a hierarchy.
Drill Down
Drill Down operation allows users to step down the hierarchy, from the most aggregated values to the most detailed ones. For example, “year” to “month” to “day” in the Date dimension, “country” to “province” to “city” in the Geography dimension.
Slice
The Slice operation extracts a subcube from a cube by selecting a value for its dimension. For example, we can retrieve a “slice” from a cube showing the number of internet sales in all countries for all years by choosing “Austria” as the value of the country dimension.
Dice
The Dice operation is an “extension” of the slice operation as it allows users to extract a subcube by selecting values for several dimensions. Using the example above, we can perform the dicing operation by selecting “Austria” for the country dimension and “2017” for the Date dimension.
Pivot
Pivot operation figuratively rotates the cube in order to provide a view of the OLAP data from an alternative perspective. This operation allows analyzing the data from different perspectives, making it one of the most important OLAP features for creating analytical reports.
You can see the graphic representation of the main operations in the figure below.
These are just the main OLAP operations. Other operations include drill through, scoping, screening, etc.
All these operations are illustrated in OLAP diagram above.
OLAP APIs
Microsoft company released the first standard API, OLE DB for OLAP (ODBO) in 1997. Four years later, they announced XMLA as the standard for data access in OLAP tools. To date, they remain the industry standards that most vendors accept.
ODBO introduced MDX as the query language for multidimensional cubes. It was written specifically for business analysts and bears a slight resemblance to SQL. MDX is the only query language that is a standard for XMLA and is used by most online analytical processing tools. Some systems, like Oracle, for example, implement the functionality of OLAP in SQL language extensions but also support MDX.
OLAP Functions
Unlike OLTP, OLAP supports just read-only queries. That means there are no functions for data editing, but only for its selection – select.
MDX syntax is complicated, but there are some basic concepts:
- Multidimensional Expressions functions for cube members include:
- .Children,
- .Parent,
- .Level,
- .Hierarchy.
They return the member’s child elements, parent element, hierarchy level and the hierarchy itself, respectively. .Members function can be applied to axes, hierarchies and hierarchy levels and returns all members.
- MDX allows you to select Sets (members from the same axis), Tuples (members from different axes), and Sets of tuples (using the Crossjoin function). Filtering in MDX is introduced using where.
- All cube elements (dimensions, hierarchies, levels, members, etc.) are written in square brackets. While sets and tuples are written in parentheses.
- MDX also provides functions for calculating custom members (both measures and attributes) that are not currently available in the cube.
OLAP Analysis Tools
Nowadays, the market offers a large number of OLAP data analysis tools that cater for users’ versatile business needs. There is no shortage in vendors also. The customers have a lot of freedom choosing whether they want to work with MDX or SQL and what type of OLAP will work best with their system architecture (ROLAP, MOLAP, etc.). There is also convenient when some of vendors provide OLAP tutorial, documentation and demo.
We can single out two main categories of OLAP tools available on the market:
- The first example of online analytical processing system encompasses the server-side tools like OLAP servers. They occupy the spot between the data warehouse and the client application and aggregate the data from the database into cubes. Server-side tools also provide advanced calculation options, data access security, and other server-side functionality.
- The second type includes client-side tools that provide easy and comprehensible interfaces for business users. It allows users to work with data and create OLAP reports without any specific IT or business analysis skills. These tools usually provide such functionality as ad hoc report generation, drag-n-drop interface, data visualization, working with KPIs, etc.
Two of such tools are Ranet OLAP and Ranet Analytics.
About Ranet tools
Ranet tools provide end users with intuitive easy-to-use OLAP interface to work with their business data.
Ranet OLAP tool is a library of powerful components for:
- data analysis,
- reporting,
- KPI analysis,
- trend analysis,
- data visualization.
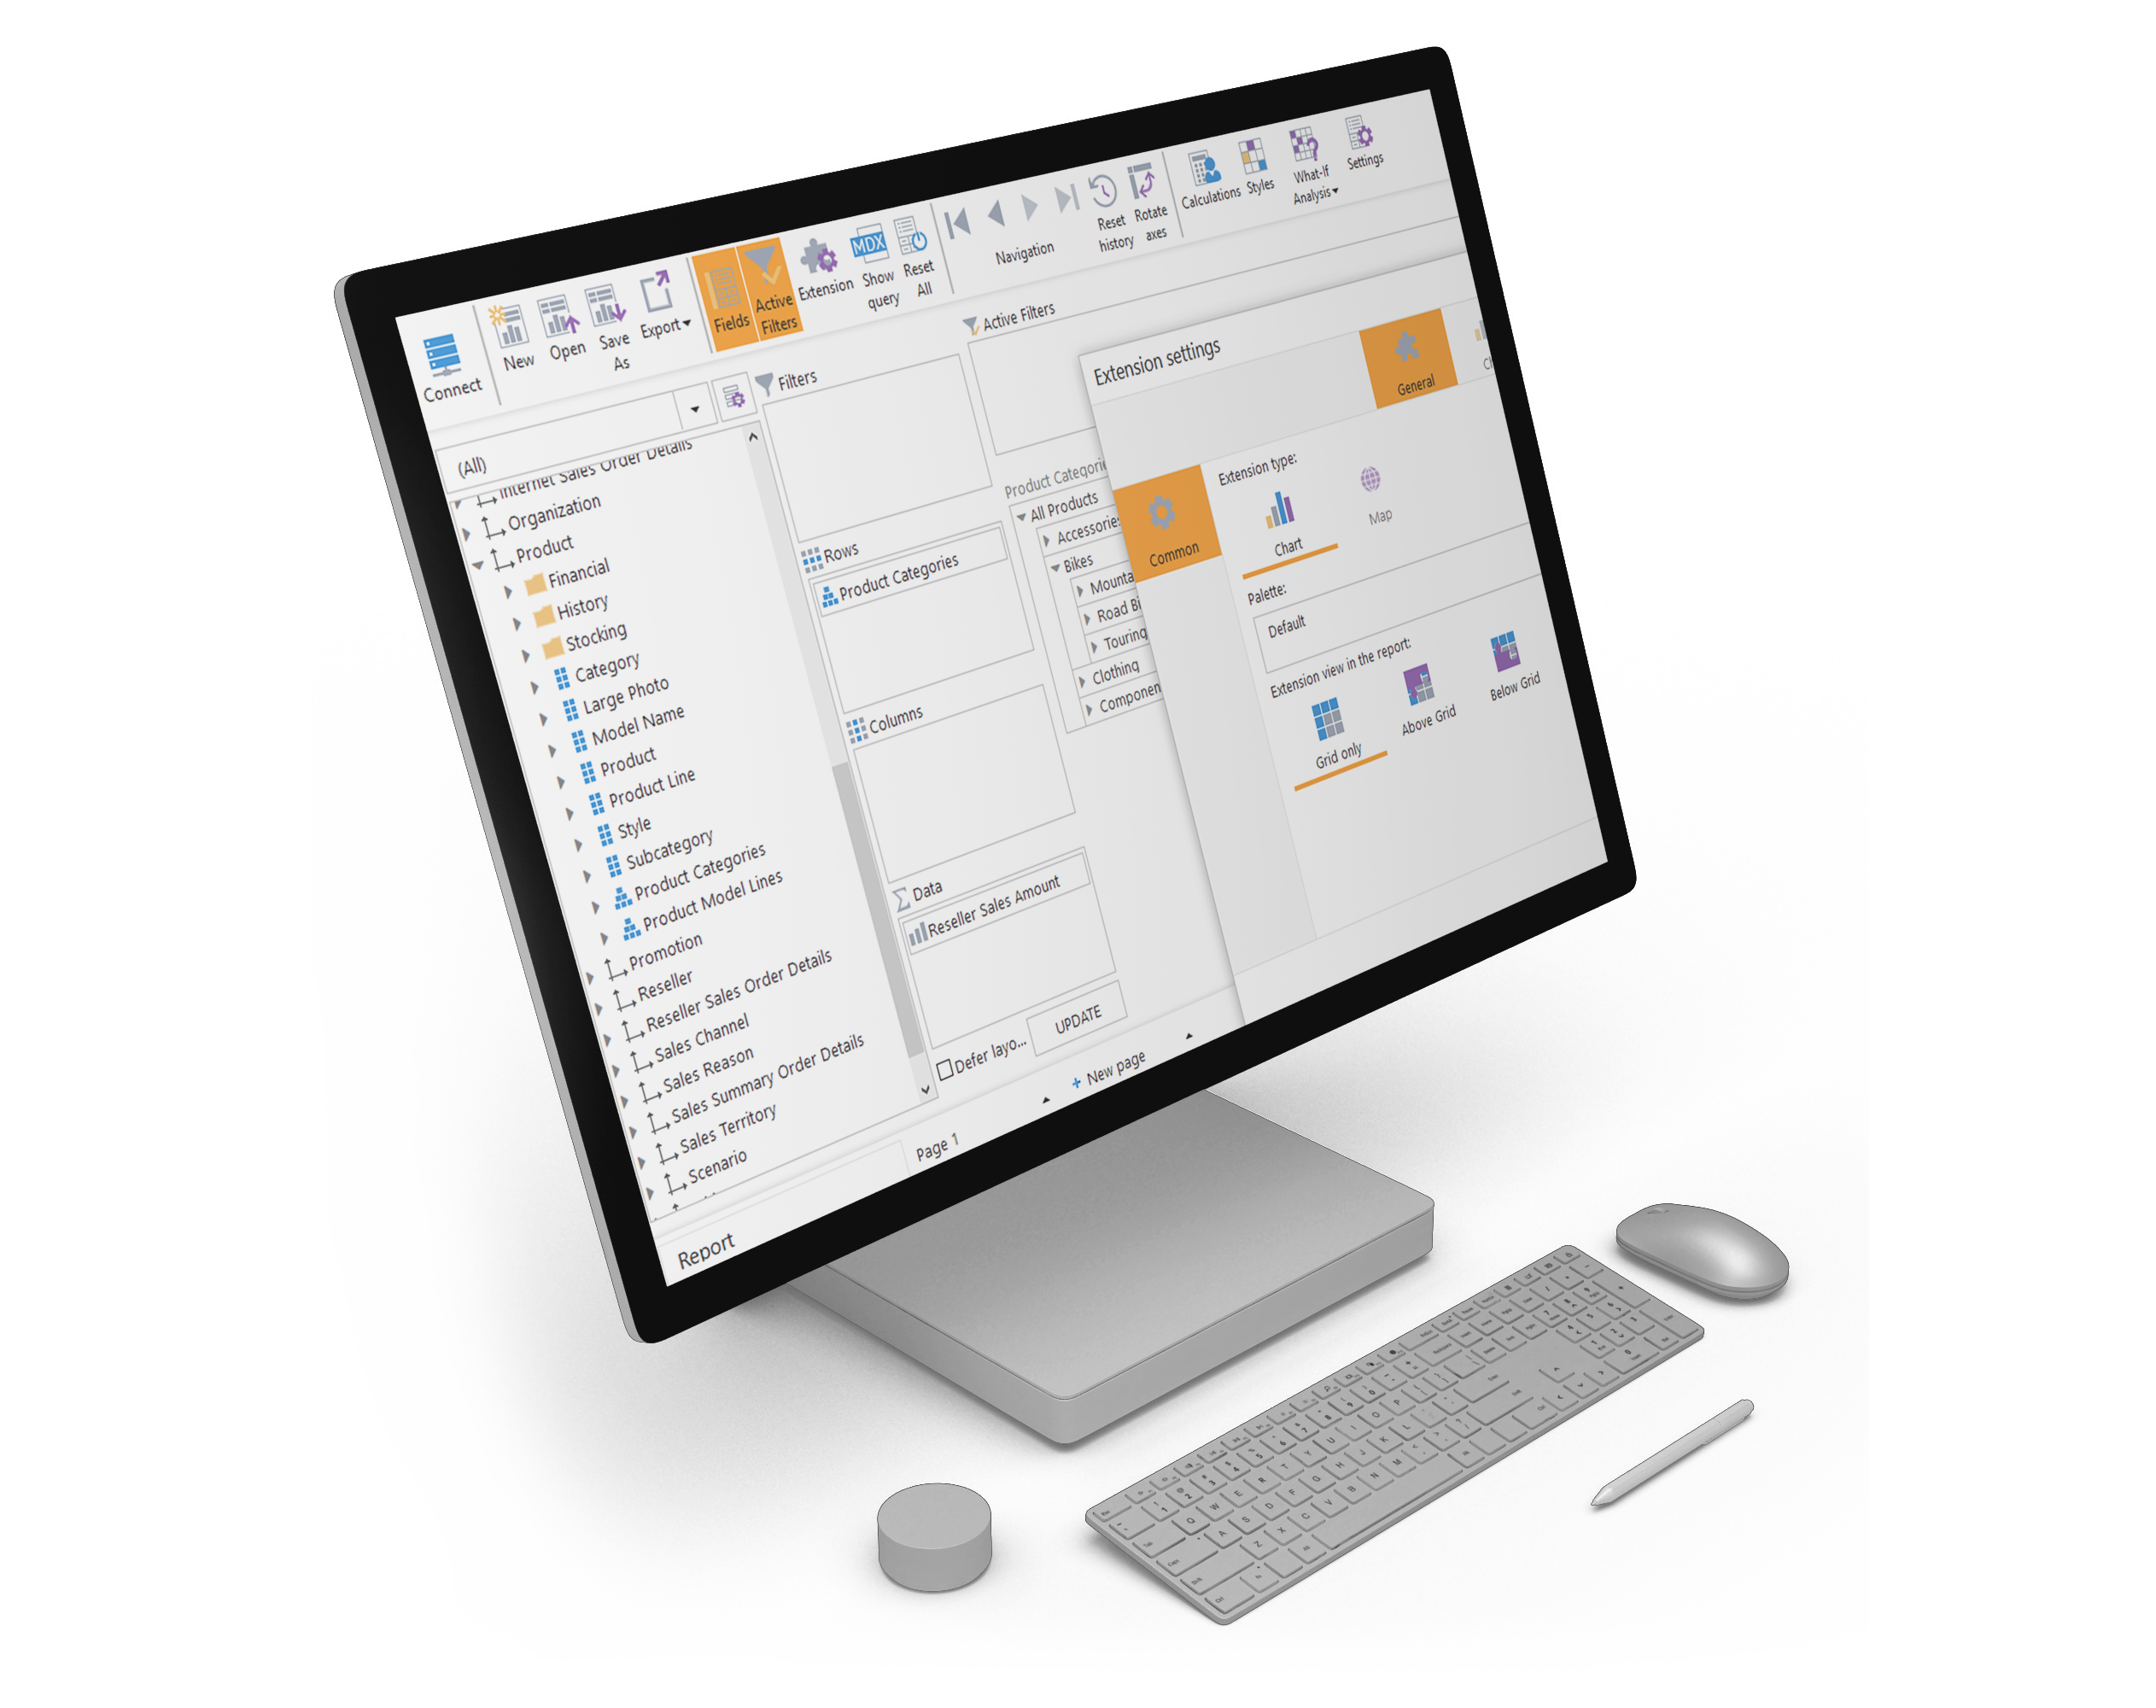
Ranet allows end users to connect instantly to their OLAP data source and create interactive reports by simply dragging and dropping elements from the cube to the report designer area. A built-in cell style designer allows creating custom formatting styles for pivot tables, making it easier to spot underlying data trends. Special extensions allow visualizing your report data on different types of OLAP pivot charts.
For those users that know MDX syntax, Ranet also provides an option to write custom MDX queries and create custom calculations. This helps users to extract and analyze data slices that are not readily available in the cubes.
Ranet OLAP offers demo and 30-day trial. So you can download the tool and use it for free for this period following Ranet OLAP 30-day trial version.
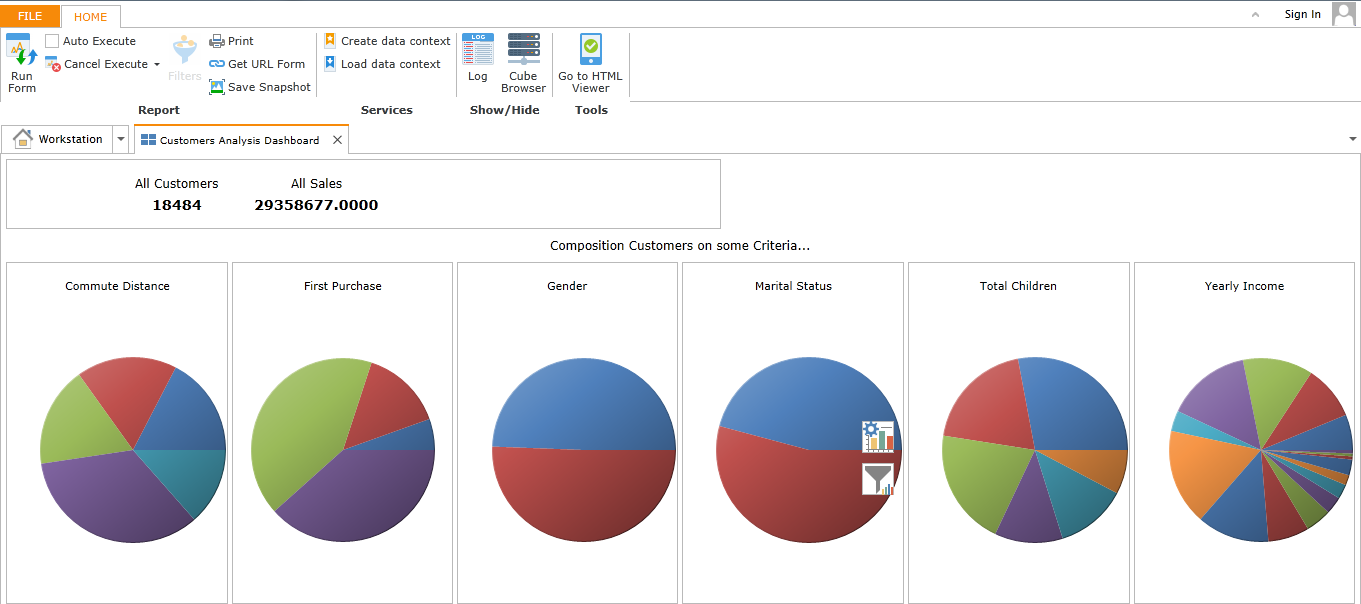
Ranet Analytics provides end users with interactive dashboards for visualizing the data in their ad-hoc reports. It allows analyzing various aspects of their business and determining trends in their data, which helps to make more grounded and informed decisions about the business development. Besides, it also significantly improves the overall look and feel of OLAP reports.
Both Ranet OLAP and Ranet Analytics can be easily embedded in the users’ applications and customized to their visual style.
Advantages and disadvantages of OLAP
So what is importance of OLAP? Like any other technology, online analytical processing has its advantages and disadvantages that need consideration before database and data warehouse design and implementation.
Main Advantages
- The most important advantage of OLAP tools is their speed. The main reason for developing it was the inability of other systems to process queries fast enough. Due to aggregation and pre-computation of data, the system can execute complex queries in just a tiny fraction of time in which the same query will be processed in OLTP.
- Another considerable advantage is advanced calculating and data analysis options. OLAP is heavily used for data analysis and BI purposes, which incentivizes vendors to improve the computational power of their tools constantly. MDX is a powerful instrument that offers numerous options for data extraction and analytics.
- Data representation is another important advantage of using OLAP for analytics. Not only multidimensional data structure is convenient for the human brain to visualize and comprehend, but also it offers an opportunity to rotate the data and analyze it from different perspectives. The cube structure provides an option to not only analyze actual data but also create what-if scenarios for business modeling using write-back partitions of the cube.
- Besides, it has a relatively flat learning curve. Created for business analysts rather than engineers, it allows end users to operate easily comprehensible business terms. The help of database and IT specialists is rarely required for designing and creating OLAP reports.
Disadvantages
When designed and used appropriately, Online analytical processing system has hardly any disadvantages. However, this technology has a number of limitations that prevent it from being used in certain situations.
- One of the biggest factors that can become a disadvantage is that it requires a lot of storage space. In most systems, the data is aggregated and pre-computed before storing in the cubes. That leads to steep increase in the amount of data and can potentially result in data redundancy. In order to avoid it, a lot of OLAP tools use powerful data compression algorithms. Besides, some systems don’t aggregate the data at all or aggregate just parts of it. However, depending on the database size, data warehouse architecture, the purpose of the system and other factors, these steps are not always effective.
- Another disadvantage is that the system can’t process a large number of queries. It was designed to process a small number of queries that are more complex in nature and will perform poorly when required to execute multiple queries.
- One more disadvantage is that it is impossible to update data in the cubes often. Again, as the data in the cubes is aggregated and pre-computed, the update process will take a considerable amount of time. OLAP works with a large amount of historical data that is not supposed to be frequently updated. If you need to process a lot of current data it will not perform well.
Application of OLAP
As we have already mentioned above, the main asset of online analytical processing is its powerful data analysis capabilities. It determines extensive use of OLAP in business intelligence and reporting applications.
Standard examples of OLAP applications include marketing analysis and planning, sales analytics, business modeling and forecasting, financial reporting and other spheres. Online analytical processing tools are widely used in data mining, providing insights into the company’s data trends and delivering information to the management used in the company's’ problem solving and decision-making processes.
Thread: top asked questions about OLAP
In conclusion, we collected top question users ask about OLAP. Let’s overview OLAP benefits and capabilities one more time to summarize it up.
- What is an OLAP system?
Online Analytical Processing is a computer processing technology that allows rapid execution of complex analytical queries. It is an important part of business intelligence, providing powerful capabilities for data mining and trend analysis. The system helps to analyze big data amounts from different perspectives rapidly.
There are three types of online analytical processing systems:
- ROLAP (Relational OLAP): stores all data in relational databases;
- MOLAP (Multidimensional OLAP): stores all data in multidimensional data cubes;
- HOLAP (Hybrid OLAP): a relational database and multidimensional cubes divide the data.
There are also some other OLAP types so you can choose the best option for your business.
- How is OLAP used in business?
As it was mentioned above OLAP capabilities allow processing large data amounts very fast that helps to speed up the company’s work and efficiency. Online analytical processing helps employees and management quickly analyze important information, and then they can identify trends, quickly look at exceptions, and find out the reasons for your company's market or business processes. This will give company the perfect tool for improving the organization’s business processes or for developing a new market strategy.
- What makes a good OLAP system?
The answer is of course, benefits, which OLAP can bring to your business. So the system is good one if it provides you with the following:
- Time saving;
- Improve financial positions;
- Satisfies customers;
- Improve decision-making processes.
- What is the role of OLAP in decision-making?
Every mistake in business leads to loses. That is why it is relevant to find the solution for assistance in making the right successful decisions. Online analytical processing systems are the powerful sources to facilitate decision-making processes. Reporting and forecasting tools that system offers, aimed to help in making the right decisions
