

What is BI
According to Gartner glossary business intelligence (BI) is an umbrella phrase that involves applications, infrastructure, tools, and best practices which ensure access to the analysis of the requisite information to boost and enhance performance and decisions with the help of multidimensional libraries, forecasts, ad-hoc analytical reports, etc. To put it simply Business intelligence with a help of BI architecture incorporates all the technologies and methods to analyze data belonging to the business. Depending on a tool used by an enterprise or a company BI includes current, historical and predictive information of operations and transactions. Those technologies and methods are traditionally intended to facilitate big data interpretation by searching insights for a business, which otherwise wouldn’t be obtainable. As a rule business intelligence programs are utilized both for taking rapid business decisions and strategizing.
As for rapid solutions, also known as operational decisions, they customarily comprise product marketing and price formation; when it comes to strategy developing - a user would need to determine priorities, targets and the field of concern. To that end, the best method for a business will be to merge external and internal data to analyze them combined together. Whereas internal data are drawn from inside company sources (finance, marketing, sales, hr), external data represent all data outside the company’s operating systems. After being combined the data serve as a completely new set of information through which a user can create complex reports and attain new insights for the competitive edge and long-lasting sustainability. Consequently, owing to business intelligence systems and services organizations get empowered to estimate current product demand and supply in the market and choose the most appropriate development pattern.
The emergence of Business Intelligence
Today business intelligence is often taken as a marketing catchword in relation to the splash of big data and data analysis. Nevertheless, some say BI had descended from business reporting and didn’t reach far since then. However, the very term was firstly used in the Cyclopædia of Commercial and Business Anecdotes in 1865 by Richard Millar Devens.
The author described a story where a banker made a profit from the information about the situation around, which he was the first to receive. The banker surrounded himself with business intelligence technologies and benefited due to the early awareness of the news. That is how business intelligence concept and meaning appeared. Roughly speaking BI is an opportunity to gather meaningful information for the purpose of thorough analysis.
Later on, in 1958 Hans Peter Luhn from IBM employed this collocation in his article using a Webster's dictionary definition. The dictionary stated business intelligence as an opportunity ability to detain the interrelationships of presented facts in a way to direct to business towards a set goal.
Although today’s term of BI acquired its meaning from the decision support systems introduced in the 1960s. A decision support system (DSS) in its turn is an information system which involves a knowledge-based system and an interactive software-based system directed at backing decision-taking processes. The main peculiarity of DSS is that it mostly deals with unstructured or semi-structured decision issues.
Thereafter Howard Dresner suggested an umbrella phrase to define business intelligence without compromising it through a certain technique or approach. Under the definition, BI included concepts and methods to improve business decision making by using fact-based support systems.
Regardless of the distinction in the definitions and business intelligence synonyms, it is worth paying greater attention to the features and components encompassed in BI for a better understanding of the very process.
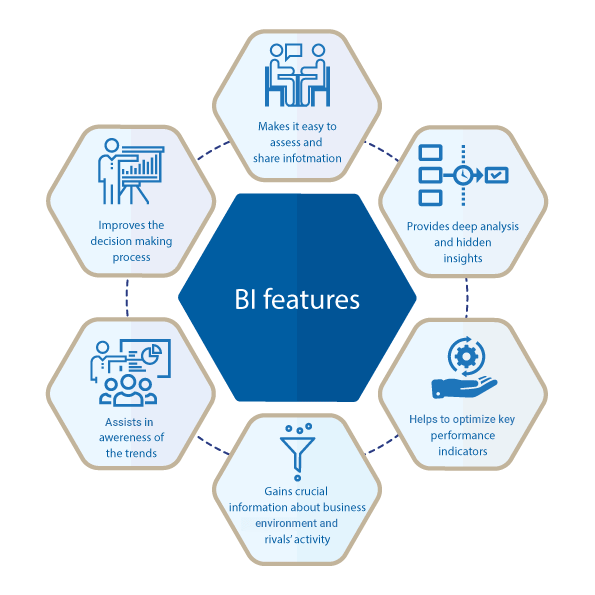
BI features
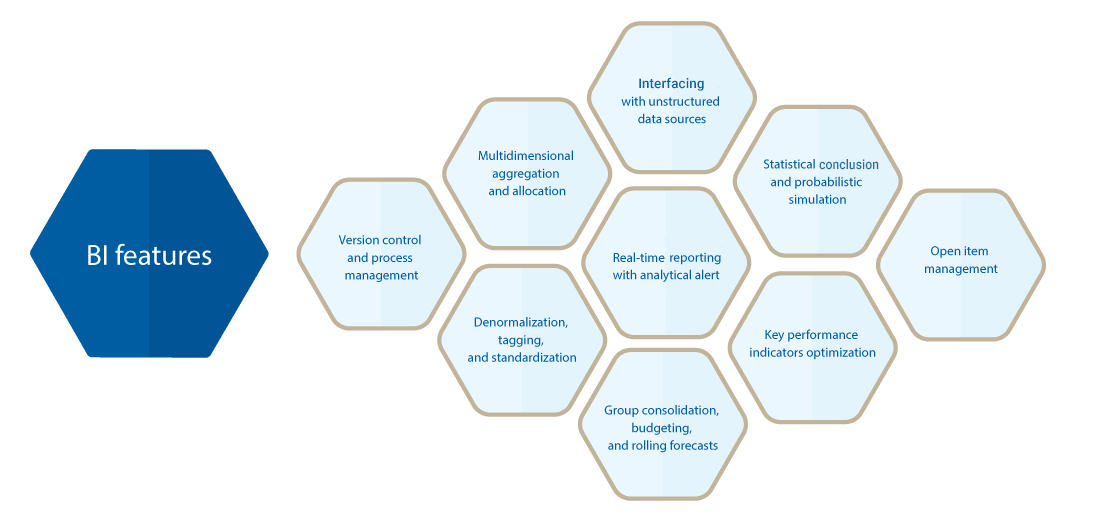
Owing to business intelligence, businesses obtain a great variety of analytical tools at their disposal. All of the tools are aimed at more sophisticated data management, processing, and reporting. Depending upon the technical specification those BI tools let users look at their business activity deeply and extensively and pick up the best applicable tailored solution. Let's take a closer look at the business intelligence features below.
Multidimensional aggregation and allocation
Multidimensional data structure and numerous dimensions in business intelligence let a user rapidly navigate through the system and analyze the data from various perspectives. Thanks to the use of the this feature aggregations the business intelligence system processes the queries almost immediately.
Denormalization, tagging, and standardization
All these three BI strategies are intended to prepare the data for further business intelligence analysis.
Denormalization is a technique applied to a formerly normalized database to improve performance, resulting in at joints number reduction and operations speeding up.
Tagging is a BI method to single-handedly append tags to the elements of unstructured data. Through tagging specific data can be scanned to help detect required objects (names, dates, locations etc.). It can also be valuable while identifying the relation between several named objects.
Standardization is a technique in which files are initially processed, assigned to applicable database record fields, whereupon being converted into a unified format.
Real-time business intelligence reporting with analytical alert
A technique enabling a user to receive the data which has just emerged or the information about the operations that have just taken place. Fast track reporting will alert about process performance indicators making it possible to launch an immediate promotion and take advantage of an ongoing situation.
A method of interfacing with unstructured data sources
By means of this BI tool, a user can use the linguistic, auditory, and visual information, which is the base for human communication. There is a common framework to process the information by a machine to retrieve meaningful data and afterwards create structured data about the requisite information.
Group consolidation, budgeting, and rolling forecasts
Thanks to data compilation and consolidation in business intelligence it’s now possible to draw up more holistic financial reports. This tool consequently provides an in-depth BI analysis including insights in a financial state. Thereby an enterprise is able to boost its support, strategizing and operational decisions. Moreover, this kind of software will consolidate and centralize all financial data in order to facilitate the work of finance managers in reporting, creating precise budgets and applying what-if scenarios, which can improve further planning.
Statistical inference and probabilistic simulation
Data analysis statistical inference makes it possible to withdraw properties of the population from a sample in order to learn the characteristics of the basic probability distribution. As a result, a user attains a practical technique to analyze all kinds of statistical problems. As for probabilistic simulation, it is drawn on random sampling to receive numeric results. This BI tool is typically used to solve deterministic problems.
Key performance indicators optimization
KPIs constitute the main aims of the business to be followed and targeted at to bring up the benefit and profit of the process as a result. The BI application will assist a user in identifying the KPIs by highlighting the requirements of the business process and establishing a performance measurement. Besides, it will help compare the results in the current report with the goals set and constantly assess the state of the performance complying with the business intelligence KPI. A user will obtain statistics collected for a better understanding of the ongoing processes.
Version control and process management
There’s always been a necessity to organize and control the logic and amendment of existing information. The need has increased with the advent of databases and data mining. Version control is intended to improve managing the changes in programs, websites, documents and other subsets of information. Its main advantage is an opportunity for several team members to simultaneously tweak the same document or file which is crucial when it comes to the activity of a company dealing with multi-developer tasks.
Open item management
Open items result from each posting transaction in an account and represent incomplete transactions. Those are mostly unpaid items so they will be recorded as open items in the contract account unless being paid or cleared. This BI application enables a user to see unresolved payables, debts, and receivables.
It’s possible to display cleared and open posting items individually in order to check if there’s been an offsetting transaction.
BI tools
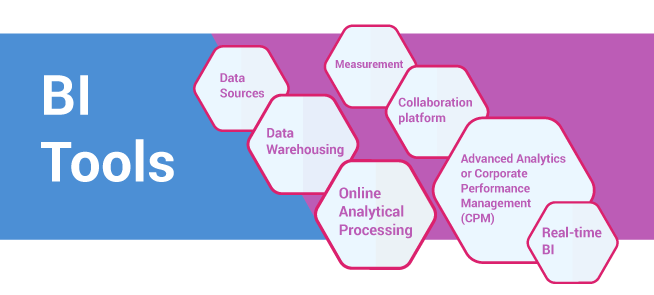
Business intelligence includes methodologies to store and process data and to extract substantial information for analysis and reports thereby bringing up significant insights for business. In order to harness primary raw data and sustain planning and strategies there are plenty of BI tools:
Data Warehousing
Due to business intelligence, data warehousing not only may a client store huge amounts of data but can also filter out certain data subsets and look through those elements which are interconnected and can assist in running the business. By examining data over the past few years through BI one will explore the tendencies and will be ready to apply seasonal promotions. It’s also feasible to compare the statistics of several business processes for better understanding how to improve efficiency.
Data Sources
Data sources in BI are strategy-oriented which contributes to a more holistic approach in problem-solving.This component also includes different stored data formats. Raw data is converted by the application to organize substantial and easy to use data sources accessible for various departments of a company. Afterwards, information can be transformed into a required format of spreadsheets, charts, tables, and graphs, depending on the needs of the department.
Measurement
One more important business intelligence engine is measurement. A BI application which composes a performance metrics hierarchy to access process results. Due to the benchmarking analysis and reporting, it keeps a user aware of the progress or regress against the goals so they are ready to change the strategy of business management if necessary.
Collaboration platform
This BI tool is up to provide an opportunity to interact and work together and share data. Depending on the platform type it makes it possible for users to engage and simultaneously edit the same file (with a chance to see the initial variant) or separately make parallel modifications in a single file saving each edit as a variant of the initial file.
Online Analytical Processing
With this type of business intelligence applications businesses can store data aggregations in multidimensional cubes. Due to the structure queries are processed very fast which drastically facilitates carrying out ad hoc analysis, applying ‘as if’ scenarios and comprehensive analytical reporting. OLAP may also be utilized for budgeting and forecasting. Good news for managers and executives constitutes an opportunity to create OLAP reports without IT training.
Advanced BI Analytics or Corporate Performance Management (CPM)
This range of BI tools allows observing the statistics of specific products and services. After analysis a user can bring certain alterations in the marketing. The statistics of the data may as well be exploited to foresee profits or losses in sales.
Real-time BI
Thanks to this BI application it’s possible to promptly take measures in marketing or sales in response to ongoing trends reported. Owing to real-time reporting of the process a user is able to take an advantage of their awareness and organize special campaigns or declare offers and promotions which are to play a pivotal role in a current business state.
Cloud-hosted BI software
Cloud-hosted business intelligence software is considered extremely advantageous by multiple organizations as it doesn’t require a lot of space or expensive installation. This kind of BI software is suitable for small and medium-sized enterprises which aren’t able to afford the maintenance support in the office. So far such business intelligence program as a business cloud-hosted software has become a great solution providing an opportunity for remote personnel to operate with a big amount of substantial data. Beyond that with a surge of optimized BI applications large software vendors began producing mobile-based business intelligence solutions for both Android and IOS users. Thereby it became possible to sort and mine huge data volumes not only distantly from any point in the world but also from any device.
BI & BA difference

Business intelligence and business analytics are frequently used as substitutable terms though there actually is a distinction between them.
Business analytics comprises methodologies, practices, and technologies intended to iteratively examine and process data about past company performance. Based on previous experience business analytics retrieves the insights for better understanding of the business management. Also business analytics helps users make decisions based on predictive and explanatory modeling. |Moreover, business analytics likewise includes several types of analytics: decision analytics to provide visualization for decision making; descriptive analytics to collect insights from historical data; prescriptive analytics to advise solutions by streamlining; descriptive analytics to apply predictive simulation through statistics of past performance and machine learning.
Business analytics is frequently used as business intelligence synonym but, in fact, there actually is a distinction between these terms.
This compares to business intelligence which involves technologies and techniques to assess past performance as well as to assist in generation of business intelligence strategy and plan which is likewise built on statistics. Whereas business intelligence gives a user an opportunity to look for information by asking questions, reports, and OLAP, in business analytics it’s possible to implement predictive and explanatory modeling. To put it simply through business intelligence one can ask ‘how often’, ‘how many’, ‘where is the constraint’, ‘what should be done to improve’, while through business analytics a user inquires ‘why’, ‘what if’, ‘what will take place next’, ‘what is the best to do now’, etc.
BI & CI difference
Competitive intelligence contributes to gaining awareness of what is going on in the business environment to enhance a user’s business competitiveness. It typically encompasses discovery of all possible external information about the business field and actual and potential rivals so that to improve strategic decisions of the executives. Technically CI is a process of determining, examining and extracting data about competitors’ activity in the market. In contrast to corporate espionage, competitive analysis is a completely legal practice. As compared to business intelligence, it focuses only on external business data, though both of the processes support decision making, strategizing, and reporting. In the wider sense business intelligence may be regarded as a part of business intelligence.
BI Implementation process
BI implementation is a long and hard process. An ordinary BI environment includes business and data models, business intelligence data sources, tools for transforming and organizing the data into useful information, business intelligence and data warehousing and reporting tools.
Thus before making a decision upon BI implementation an organization must take several certain steps to make sure it’s ready: sponsorship and commitment have to emanate from the top management; there has to be a real necessity in BI deployment; the data has to be structured and available.
For successful solution it’s crucial for all the staff to take part in the further BI use to realize why they need the system given it’s going to bring a big change to their work. The backing of the majority of the team provides far more assurance that the business intelligence system will become an integral component of the business process.
Constraints during implementation:
If an organization contemplates a BI employment for its business the executives ought to know which specific business intelligence features they need. It can be done through applying several scenarios which may assist in selecting a tool. After a certain BI tool is chosen through corresponding the business intelligence requirements and needs of the team the greatest graft of data processing starts. There are general stages to be taken on the way to BI deployment. Firstly data are collected from business data sources; after it is transformed into a requisite common format; when it can be queried and explored it may be acted on.
The main problem which may turn up during business intelligence implementation is the poor quality of the data. That’s why before implementation it’s a must to apply data profiling that is to examine if the data in a database is available and gain the statistics about it with a view to finding out the content, consistency, and structure of the data. Thus if there are lacks or errors it’s better to suspend the deployment and compile adequate data.
Data structure & setbacks
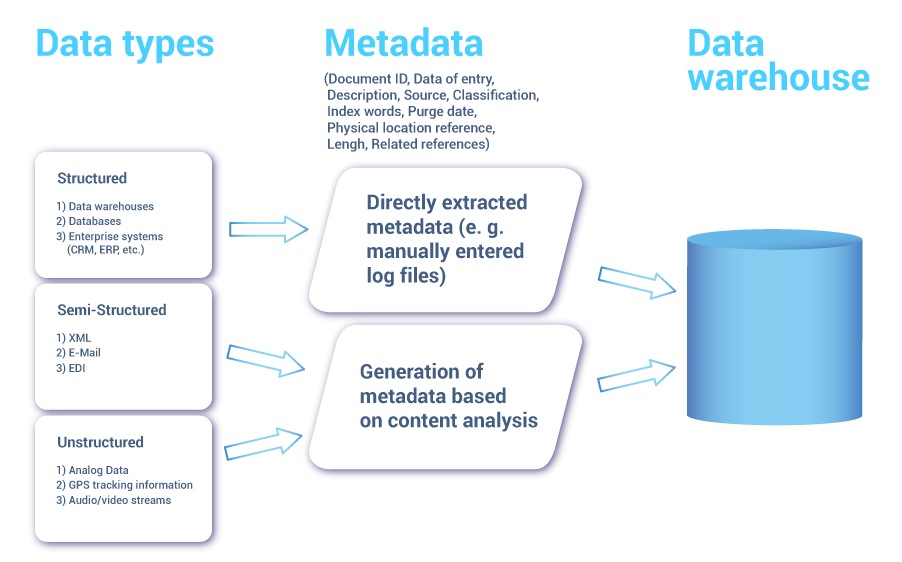
During the years business organizations generate vast amounts of semi-structured or unstructured data: information in all possible files and formats such as business intelligence charts, notes, spreadsheets, images, videos, emails, etc. Such types of information documents make up much more than a half of all the data which is up to change a pivotal business decision. According to Gartner research managers spent up to 40 percent of the working time on searching for necessary information in the piles of unstructured data. Though unstructured data are hard to examine as it can be just knowledge about potential trends it can’t be overlooked as contains essential information and potential insights for business.
With an eye to establishing a complete BI software, it is obligatory to save the business knowledge of the team members as it can have a big clout in the future. However, there are typical obstacles in examining the unstructured or semi-structured data for further seamless business intelligence use. Firstly, it is stored in multiple formats so it’s extremely challenging to physically explore it and secondly there’s commonly no standardized terminology among users which causes complications in the search. In relation to terminology, a simple search can be very rough. It reflects only the results with the very precise term searched without references to synonyms.
Moreover, when it comes to relational databases it is simply not possible to store unstructured data in prescribed columns and rows. Nevertheless, a big amount of unstructured data (emails, text files, images, and videos) can be stored in metadata - data which provides information about other data. This type of data may encompass information about an author, file name, size, creation and edit time and luckily can be stored in a relational database. To enable and facilitate the process of search and assessment of the data one should know the content and append context through metadata. There are technologies to create content metadata: automatic categorization and information extraction.
Usability & competition
The users of the BI system implemented may become discouraged and waste much time trying to understand how to exploit the system or even get futile if the usability level is low. Ideally, the software has to be caught on and exploited by the end users in order to strengthen the company. Therefore it is a good game play to initially interview end users and figure out their expectations of the changes. The next step must be to interview development department members in order to identify to which extent users’ requirements of the business intelligence system can be realized regarding the data condition. A personalized approach before the installation will ensure a bigger probability of fast approval and acceptance of the BI system.
Additionally, it is likewise possible to introduce an element of competition, as this element may play a role of an impetus. When coworkers compare themselves to each other in relation to the use of the system it may significantly encourage them to use it more.
Senior management should also bring about training and support needed to provide smooth adoption of the BI tool. As for support, it may be a help desk support to enable team members to resolve user problems in the business intelligence application as soon as they emerge. All the named incentives can substantially boost team performance.
How to choose a BI vendor
Today it’s simple to name a great number of BI vendors in BI web and what is more it is up to each company to choose whether to purchase one holistic full-service solution from one vendor or to pick various tools from several offerings.
Due to the industry specifics, a business intelligence solution should often be protected regarding the information stored. At the same time, the data must be fully available to the customer. That is why one ought to see a business intelligence in detail and carefully select a vendor and a software so that the latter is pliable to the requirements.
The following vendors do not make the list complete but are used to be taken as best of breed:
- IBM
- Microsoft
- Oracle
- SAP
- DevExpress
- SAS
- Information Builders
We are glad to add our system Ranet OLAP to the list as one of the main BI solutions. So far Galaktikasoft has succeeded in providing businesses with sophisticated and rich systems for comprehensive management and analysis in the business intelligence environment.
