
PIVOT GRID
This page describes the functionality of an earlier version of Ranet OLAP for Silverlight. For up-to-date information about these features, refer to the Simple Pivot Table control description.
Ranet OLAP Pivot Grid control is designed for multidimensional data analysis and data visualization. It shows a summary table resulting from running the MDX query.
The main advantage of using the Pivot Grid to analyze multidimensional data is its ability to provide context to different types of data. OLAP data is often stored in several forms (as ratios, counts, sales, etc.). In the pivot grid, it is easier to distinguish which type of data is in the report. If it is a ratio, a percentage (%) sign may be displayed; if it is a sales figure, a dollar ($) sign may be displayed, etc.
The main functionality of Ranet OLAP Pivot Grid control.
Pivot Grid control can:
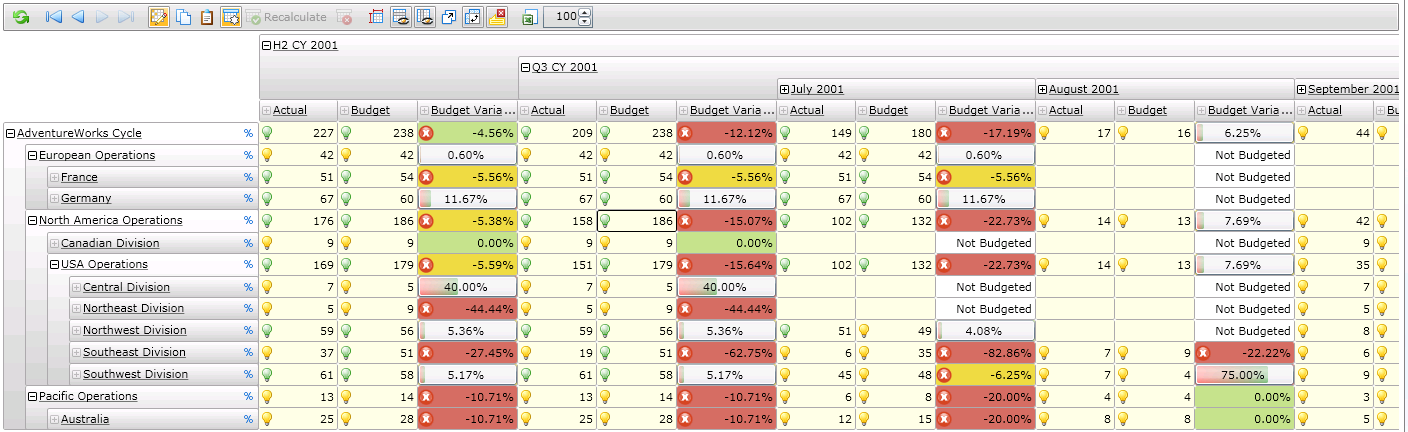
- Show values using the visual parameters of the cells determined in the cube or MDX query (BACK_COLOR, FORE_COLOR, FORMAT_STRING, etc.).
- Display icons and indicators, show gradient filling and formatted text in the cell. Learn more in this blog post: Pivot Grid. Style designer.
- Display custom properties of dimension members (for example, color, size, price, etc.). Learn more in this blog post: Properties, Custom Properties.
- Generate member names in the row or column title areas using various algorithms (for example, Caption, Caption+Key, Key).
- Control data detail levels using Expand, Collapse, Drill Down commands.
- Show or hide empty columns or rows.
- Translate (rotate) rows and columns.
- Arrange (sort) members in rows and columns based on various conditions. Learn more in this blog post: Sorting.
- Group members within rows and columns.
- Navigate the query history.
- Scale the displayed data (Zoom).
- Copy cell values (a selected portion) to the Clipboard.
- Show pop-up descriptions and context menus for the dimension members and cells.
- Export data to Microsoft Excel for further processing or analysis.
- Show the detailed data behind the value of an indicator shown in a cell, in a special window. Learn more in this blog post: DrillThrought.
- Show System properties (Member Properties) and Custom Properties of the dimension members.
- Show the MDX query used for generating the pivot grid table in a special window.
If the group of cube measures supports editing, i.e. it has a writeback partition, Ranet OLAP Pivot Grid control allows to:
- Edit the cube data using a special entry field and an MDX expression describing the cube renewal algorithm (the UPDATE CUBE command).
- Highlight editable cells and cells edited by the user with special background colors.
- Calculate value of the edited cell based on the current data context, using operators and functions available in the MDX language.
- Paste cell values from the clipboard.
- Undo individual changes or the whole block of changes (restore table data in the initial state or state before recalculation).
- Save changed data in cache memory and send them to the server for synchronization and recalculation on a user’s command.
- Highlight the cells containing changes and synchronized with the server in a special background color.
- Isolate the changes within a user session (keeping the changes inaccessible for other users) until the transaction is fixed.
When showing the query result and further processing the query by the user in the pivot grid, settings of the SQL Server security model for the Analysis Services data, the user’s role, and the current data context are taken into account. Thus, Ranet OLAP Pivot Grid control ensures the necessary level of data security.
