
MDX report templates are a quick solution to business challenges for new opportunities
A Template is a generic, reusable and efficient solution to a frequently occurring business problem.
Report templates are solutions. Always stay On Top.
How to manage your inventory effectively? How to optimize the supply chain? Business raises many such questions. And many users have the feeling that in order to be able to analyze supply chains and thus improve inventory management, you need to be an Excel specialist or data analyst.
Indeed, there are advanced methods of analysis that require special expertise, are often expensive, but can lead to positive results. But precisely because of their complexity, they remain little known or unknown, despite their proven effectiveness.
Thousands of IT professionals, financial analysts and consultants, managers and users of BI systems around the world constantly implement complex business scenarios while creating analytical reports. Often they have to solve a problem once, twice, three times… but for different use cases and different environments. In this case, as a rule, a copy of some basic report is created. The number of such reports is growing, they are becoming difficult to maintain and administer. And at some point, specialists feel that the next time they have to answer the same question, they would like to have a ready-made solution.
It is for this reason that we have developed template-based visual designers for analytical reports. We have collected the analysis scenarios that are most frequently repeated and created a set of templates designed to solve them effectively.
Rediscover and master data analysis techniques.
The purpose of the templates is to allow users to create analytical reports in minutes directly in the system, without the need to export data to Excel for further processing and analysis. Just a few mouse clicks and voila - here is a dynamic analytical report that provides complete information and looks presentable.
Why is it so important? Consider, for example, the Pareto Principle (Rule 80/20), which has been organically absorbed into the fabric of modern society and is applicable to a variety of life situations.
The Pareto Principle states that for many things, 80% of the result comes from 20% of the effort - The 80/20 Rule. The Italian economist Vilfredo Pareto noticed back in 1895 that 80% of Italy's land belongs to 20% of the country's population. Having discovered this inequality, Pareto saw that in other countries, wealth was distributed in more or less the same proportions.
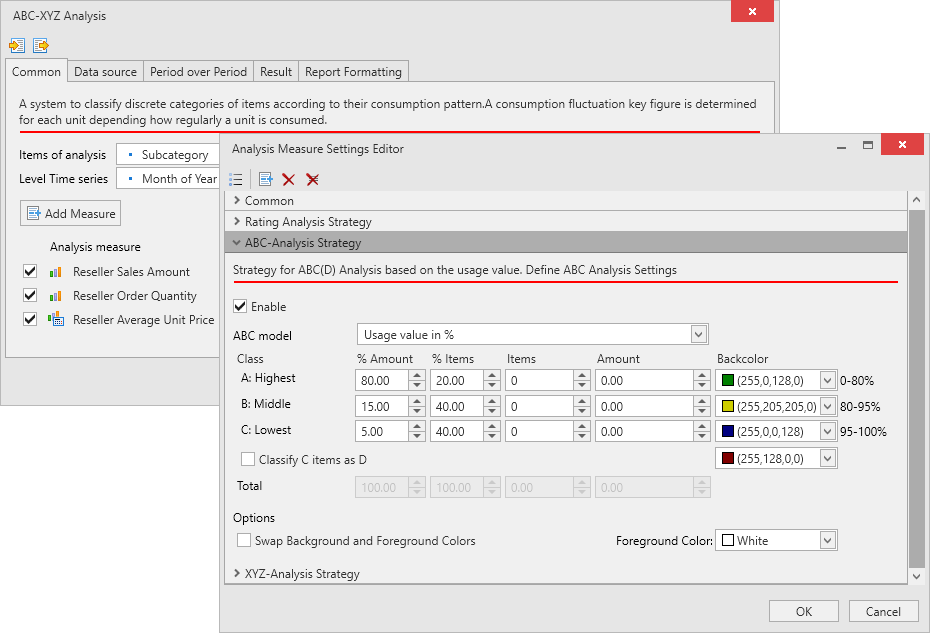
The Pareto principle is at the heart of ABC analysis. To use this analysis tool in the pivot table designer, even a highly skilled user needs to make a lot of effort, the process of creating a report is multi-step. Consider the main steps:
- Selection of data for analysis taking into account filters and other parameters, sorting them by analysis indicator in descending order;
- Calculation of the total value of the indicator for all objects of analysis;
- Calculation of the share of each object of analysis in the total value of the indicator;
- Formation of the cumulative value (progressive totals) of shares for each object of analysis;
- Division of objects of analysis into three categories (groups), according to the cumulative value of shares:
- A - give 80% of the cumulative value;
- B - give 15%;
- C - give 5%;
As you can see, only the first three steps are easily implemented in the pivot table designer, all subsequent steps require significant effort and high qualifications from the user. And what if, it is required to carry out such an analysis for a variety of indicators, using various methods for the formation of classification groups, etc. etc. Such task often becomes impossible even for professionals. Excel will help out, all calculations are quite easily implemented in it. But it's much better to quickly get the right information directly into the system, thereby saving time and money.
Another purpose of the templates is to make the creation of analytical reports simple, fast and reliable even for professionals who are experts in MDX. They have to solve business scenarios of varying complexity, and templates will allow them to quickly solve technical problems and create reports many times faster.
Our ultimate goal is to create a bank of solutions based on our Ranet OLAP that will help the main users of business intelligence systems to conduct effective analysis based on multidimensional data.
We share a passion for business intelligence based on multidimensional data and MDX, as do many very different professionals.
With report templates, business users find a turnkey solution to their problems, IT professionals and business analysts improve their MDX skills based on queries we have developed, which increases business efficiency from analytics services.
Report templates are the simplest and at the same time an important and valuable form of our business intelligence expertise.
In addition, in our BI systems implementation projects, we have the opportunity to work directly with end users and receive feedback from them on templates, suggestions for their improvement and implementation of new templates.
In Ranet OLAP analytical report templates:
- We have provided the ability to easily create analytical reports for any areas of activity and industries, projects, clients and users;
- We generate a dynamic report layout, not a final MDX query, the user can change it using all the features of the pivot table designer, save it for reuse, share it with others;
- We have removed all the limitations of analysis methods related to the one-dimensionality of the analysis, report templates provide the ability to group complex multidimensional objects and evaluate them simultaneously by several indicators;
- We generate dynamic versions of reports, where the classification and ranking of objects of analysis is calculated instantly in relation to all filters, including user and system ones, which are defined externally and are not available to the user;
- We have implemented “New, Regular and Lost” comparison models to analyze new and regular customers based on purchase history, etc.;
- We implemented the “Volume, Price, Mix” variance analysis model, which is very important for the analysis of revenue and income variances;
- We paid a lot of attention to the comparison analysis template, as it is the most popular among users and at the same time very difficult to implement. We have seen this from our own experience and expect this template to become an absolute hit;
- We have paid considerable attention to calculations related to time periods and aggregations;
- We paid more attention to report formatting to ensure ergonomics and user efficiency, while formatting settings will be saved when exporting the report to Microsoft Excel;
- We have optimized the formulas for calculating custom calculations and all the MDX query code for performance and are constantly doing this work.
We included the most popular analysis techniques in the initial set of templates, and we expect them to be useful to our customers and the community.
Many of the calculations implemented in templates can be computationally intensive, so efficient implementation of MDX query generation algorithms is an important part of the template.
This is not to say that the templates and the models implemented in them are the best that we could come up with. This is a test run. We are open for cooperation. If you can make the template better and faster, let us know!
We publish a series of articles and videos from which you will learn:
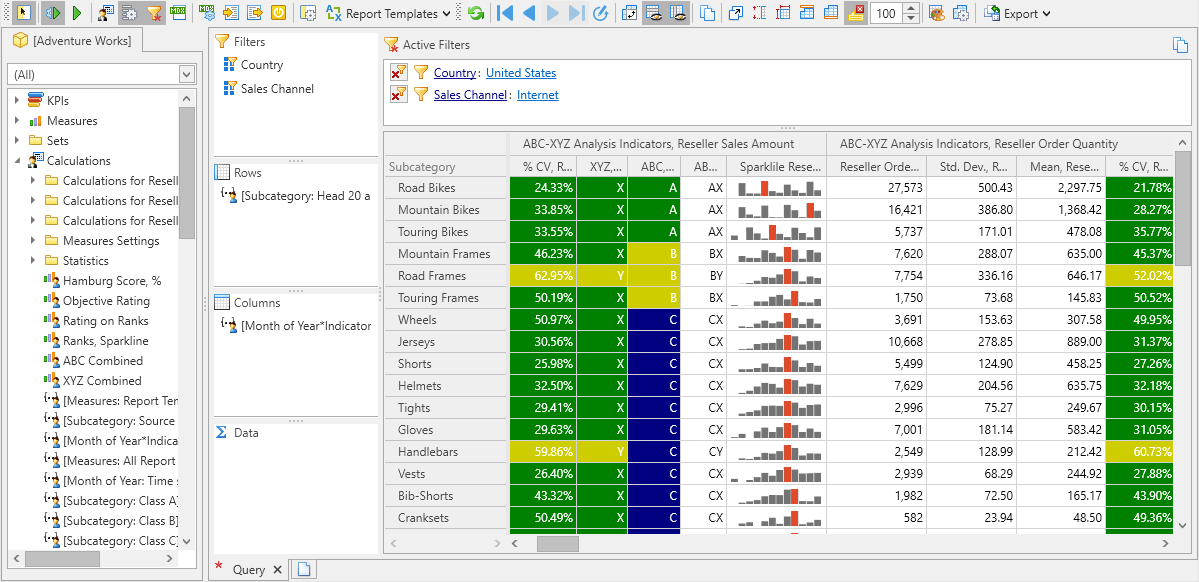
- How to conduct a dynamic classification of ABC/XYZ product range for groups and individual products in just a few mouse clicks;
- How easy it is to rank clients and suppliers by a variety of indicators and calculate the integral rating;
- How to quickly create analytical reports to analyze deviations, identify lost customers, analyze flows of money, prices and more.
