
OLAP is based on the idea of a multidimensional data model, which is familiar to human thinking. Exploring some subject area, a person formulates questions in various dimensions. He can build and change logical images, considering data from different points of view. The data is presented as a multidimensional cube, where each face defines a unique dimension containing the main attributes of the analyzed business process. Dimensions and Measures (Measures), the key concepts of the cube, define the axes in a multidimensional coordinate system. At the intersections of the axes, there are data that quantitatively characterize the business process. The user gets a natural, intuitive data model.
Most modern Decision Support Systems (DSS) are based on BI technologies (Business Intelligence), at the core of which is the OLAP (Online Analytical Processing) data processing technology. OLAP technology is a powerful data analysis and decision support tool and is supported at the core of products such as: SAP BW, Microsoft Analysis Services (SSAS), Oracle Hyperion Essbase, IBM Cognos, Microstrategy, etc.
However, the advent of scalable and cloud technologies such as Hadoop, Spark, Cloud, the explosive growth of data, its easy availability and lower storage costs have led to the fact that developers of BI platforms and solutions began to consider OLAP an obsolete technology and mistakenly believe that it could no longer handle exploding data due to scalability issues and increased processing times for cubes. Is it so? Or does the desire of users for the simplicity of the interface lead to a loss of functionality and a decrease in efficiency when working with data arrays?
Our analysis of a number of modern BI products showed that most of them do not have a full-fledged OLAP server with support for the appropriate data schemas, XMLA protocol and the MDX (Multi Dimensional Expression) query language, which is focused on processing multidimensional data models in its architecture.
In fact, the need for OLAP today is greater than ever before, as there is no other technology that can match OLAP in terms of speed, interactivity, and end user experience. Such a need has stimulated the emergence of innovative solutions in the OLAP technology market that implement optimized OLAP models that can analyze billions and trillions of data rows in the cloud infrastructure, using its flexibility and scalability.
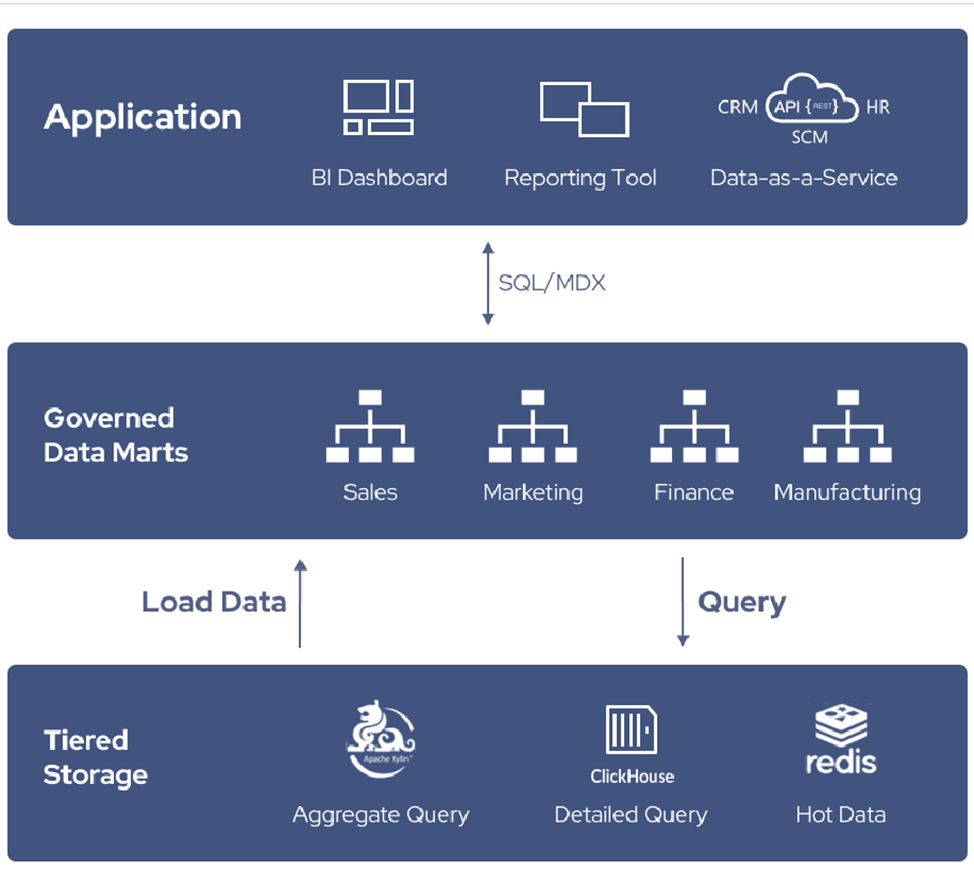
Currently, the following solutions are widely represented on the market: Apache Kylin, Kyligence, Kyvos, Pentaho Mondrian, etc. If you look at a typical solution architecture scheme (Kyligence is shown in the image below), then along with SQL, it supports MDX as the main tool of multidimensional analysis in Hadoop.
OLAP technologies make it possible to implement hybrid DSS systems that combine the elements and functions of an executive information system with the power of multidimensional interactive analytical reporting. This, in turn, allows end users (analysts, managers) to quickly discover the value hidden in huge amounts of historical and current enterprise data, providing a deep understanding of ongoing business processes and their trends, and supporting the adoption of the most effective management and business decisions.
BI systems, at the core of which is OLAP, are used especially effectively in such areas as retail, financial and banking sectors, telecommunications, insurance and healthcare, when it becomes necessary to analyze historical data for several years or decades.
Development trend of modern BI platforms
One of the BI solutions, Ranet OLAP is built on a combination of an open-source column-based analytical DBMS and Mondrian and is one of the trends in the development of modern business intelligence platforms. At the same time, this solution provides a cross-platform application server and a rich web client for efficient and convenient work for the end user.
The technology is a full-fledged functional business intelligence module for OLAP, which can be easily integrated into any application solutions, BI and Cloud platforms through a software API, and adapted to their specifics. The Ranet OLAP solution includes functional modules that provide data marts (Data Marts), interactive dashboards (Dashboards) and analytical reports that provide monitoring, control and analysis of various aspects of the enterprise.
Along with using Microsoft SSAS, SAP BW, etc. as an OLAP server, Ranet OLAP also uses high-performance cross-platform components and analytics services focused on free and open source software Pentaho Mondrian. Based on it, a flexible, integrated, scalable and cost-effective solution was created that can compete with modern analogues. One of the key features of Ranet OLAP Mondrian is the support for MS Excel format.
In modern similar technologies, the information model of the warehouse and data marts contains the most detailed data on the operational economic and financial activities of the enterprise. In such systems, built-in visual designers of interactive analytical reports are designed, with visual visualization of the results in pivot tables and charts:
- tools focused on business users;
- dynamic models for building interactive analytical reports;
- built-in algorithms for parsing and dynamic generation of MDX queries;
- report templates that implement built-in methods of economic analysis, including methods of predictive analysis.
The most valuable functionality in modern BI systems is the creation of interactive analytical reports (Ad-hoc reports) based on both ready-made built-in templates and on the basis of your own custom templates using powerful visual designers. The user can manage the structure of the report and all its settings interactively. For example, you can perform deep data detailing, enable/disable filters by elements and their properties, custom calculations based on MDX queries, micrographics (Sparkline), interactive business graphics, report export to Excel.
In modern BI systems, the one-dimensionality of analysis methods is no longer a limitation. Report templates provide the ability to evaluate and classify complex multidimensional objects by several indicators at once with their own analysis rules for each of them.
To meet management needs, effective OLAP solutions use generic business configurations with multidimensional analytic cubes (dimensions, metrics, and KPIs) for the core business processes of an organization's operations. Data from any ERP and OLTP systems used in the organization can be integrated into these structures. Typical storage, data marts and multidimensional cubes provide the speed of adaptation of template solutions for business intelligence to the specifics of the information landscape and business processes of each organization, which allows you to accelerate the implementation of the BI system. They essentially serve to transfer the accumulated knowledge and best practices of business intelligence (often only available to multidisciplinary IT companies) to a particular organization.
Advanced BI tools for business intelligence solutions enable end users (analysts, executives) to quickly discover the value hidden in vast amounts of historical and current enterprise data, providing a deep understanding of the organization's business processes and trends, and supporting the adoption of the most effective management and business solutions.
Comparison of characteristics of components and BI tools of various vendors
Many developers of UI libraries (DevExpress, Kendo UI, Infragistics, etc.) implement universal visual elements, but often when they are implemented in a solution, it is necessary to develop a lot of code that implements end-user services.
In such cases, effective “compact” BI solutions are chosen as an addition to the UI of libraries of world vendors, as a highly functional analytical reporting module.
| Comparison criterion | DevExpress | Kendo UI | Flexmonster | Kyubit | Ranet OLAP |
| OLAP as a data source, | + | + | + | + | + |
| Microsoft SSAS | + | + | + | + | + |
| Pentaho | + | + | + | + | |
| Oracle Essbase | + | + | + | + | |
| SAP BW | + | + | + | + | |
| Arbitrary XMLA source | + | + | + | + | |
| Dynamic MDX (Multi-dimensional Expressions) Engine, including: | + | + | + | + | + |
| Dynamic MDX (custom) | + | ||||
| History of design and data navigation | + | ||||
| Custom calculations (including formatting) | + | + | + | ||
| Cube Action | + | ||||
| Dynamic filters (including member choice, fixed area, drilldown by) | + | + | |||
| Settings storage including export/import | + | + | + | ||
| Cube writeback support (Writeback) | + | ||||
| Dynamic forms for entering data into a cube, copy/distribution/posting services | + | ||||
| What-if Analysis support | + | ||||
| Usage as a SaaS out of the box, including integrated security | + | ||||
| API, widgets | + | + | + | + | + |
| Integration with third party applications | + | + | + | + | + |
| Full of features for the end user experience | + | + | + | ||
| Customization to the specifics and needs of the client | + | + | + | + | + |
Growth potential of the global business intelligence market
Based on the research of the world's largest agencies Gartner, MarketsandMarkets, Mordor Intelligence and others, it can be concluded that the global business intelligence market will grow by 2 times by 2026 compared to 2020 and will grow by an average of 12% during the forecast period ( 2021–2026). With the advent of big data and the growing need to make critical business decisions at short notice, business intelligence tools have gained a significant share of the software market over the past decade. This trend is expected to grow steadily along with advances in technology and growth in investment. Drivers of demand growth are a growing focus on digital transformation in general, growing investment in analytics, an increase in demand for dashboards for data visualization, as well as a sharp increase in data volumes.
Here are just a few examples of use cases for "compact" BI solutions by development companies:
- the developer of the payment optimization platform uses the solution as a cloud service for business intelligence;
- a healthcare software developer has integrated a BI solution as a module into its DevExpress application;
- a software developer in the field of HR automation implemented a separate business intelligence application in its line of solutions, etc.
It should be noted that the interest of own IT services of companies and holdings in various sectors of the economy (retail, banks / finance, insurance, healthcare, telecommunications, etc.), which develop their own solutions to highly functional business intelligence modules, is increasing.
