
A key need for business analytics software is software for supporting the decision-making process in corporate practice. The market is changing rapidly, and companies need to have the tools to quickly respond to these changes, taking into account the growth of data volumes and the number of information systems. As a result, the demand for analytical systems is growing. In addition, the demand for analytical software in the field of data analysis forms the development of national information platforms and government systems. The requirements for analytical platforms are also growing, since it is analytics that is the result of automation for decision making and the creation of data-driven management systems.
Let's consider the key areas in which, according to the author, it is necessary to develop the functionality of BI platforms.
According to the established practice in the BI world, it is customary to classify the Business Intelligence class as products that correspond to Nigel Pendse test - FASMI (Fast Analysis of Shared Multidimensional Information):
Fast reflects the above-mentioned requirement for the speed of system response. According to Pendse, the intervals from the moment the request is initiated until the result is received should be measured in seconds. This requirement becomes more important when such systems are used as a tool for the analyst to present data quickly, as long wait times can be detrimental to the analyst's chain of reasoning.
Analysis assumes the adaptability of the system to be used in business logic relevant to the task and user, while maintaining the ease of operating data available to the “ordinary” user without using low-level special tools.
Shared describes the obvious requirement for the possibility of simultaneous multi-user access to information with an integrated system of access rights differentiation up to the level of a specific data cell.
Multidimensional is the key requirement of the concept. It is assumed that the system should provide full support for multidimensional hierarchical representation as "the most logical way to analyze business and organizations." Note that multidimensionality refers to the model of the conceptual representation of data, that is, how the user should represent the organization of data when formulating queries, and not to what structures the data is physically stored in.
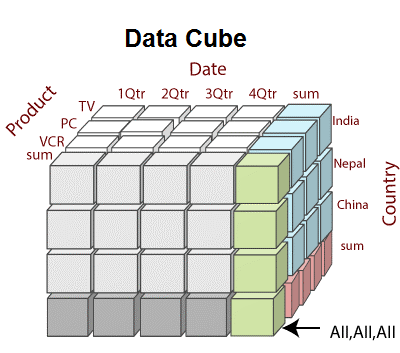
Multidimensionality within OLAP implies a conceptual representation of data in the form of a multidimensional data structure - a hypercube (OLAP cube), in which the edges are dimensions, and data (facts; measures, indicators) are located at the intersection of the measurement axes.
In this case, the dimension is usually a flat or hierarchical list. For example, the “Partners” dimension can include a list of company partners, the “Time” dimension can include a list of branches with a geographical grouping (world region, country, region, city, branch). If sales volume is defined as a measure, then on the slice by the dimensions "Partners" and "Time" we will have a table with data on changes in the volume of sales by partners over time, the row and column headings of which will be our measurements - "Time" and "Partners", and the cells at the intersection of rows and columns will contain the values of the measure, i.e. data on the volume of sales in a specific period of time for a specific partner.
Information - this is all the data relevant to the user's goals, while the presence of "extra" data negatively affects the requirement for the speed of the system's response.
Many manufacturers, to implement the above requirements, have created their own approaches - one of the options for which is to create a metalayer with data over physical data, which gives the end user freedom in presenting data in business terms. From the point of view of corporate practice of analysis, this is one of the key functionalities of BI platforms.
Unified metamap
A unified metamap with data ensures the organization of a corporate analytical process and the obtaining of the key advantages of corporate analytics - timeliness, reliability, a unified approach to presenting initial data, and is also an important node for generating change requests in transactional systems for the purposes of managing an organization. The selection of separate isolated groups with narrow competencies allows organizing the division of labor in the preparation of the metamap and, thus, obtaining the best result.
Distributed Access
The next key functionality is the availability of distributed access to metadata objects and the possibility of independent analysis within isolated groups of business users, as well as independent publication of analysis results on internal corporate resources, data exchange between users within the BI solution, creation of presentations, notification systems, mailing forms visualization for a large number of users. Accordingly, a corporate tool implies ready-made functionality for business users, without involving highly specialized employees to implement such an option.
Business glossaries
The presence of built-in business glossaries associated with the source data and the description of the methods of calculation indicators has now become relevant, since each department offers its own version of the truth, and at the data level it generates its own set of indicators, which are called the same, but are considered different methods.
To summarize, the key functionality of industrial BI systems:
- multidimensional metadata in business terms;
- distributed access for each business segment and the ability for each business to contain the results of their work in a single analytical environment;
- division of labor between groups of specialists in the course of data preparation;
- the presence of a built-in business glossary and documented calculation methods in connection with the corporate data model.
In addition, we can add that not all BI products fully implement multidimensionality in their systems - often, multidimensionality is just an imitation of working with data, without maintaining the philosophy of data management at different levels.
For example, according to the chief architect of the Ranet OLAP BI solution, many users in the corporate segment, when implementing business analysis systems, note that the most convenient way to build complex analytical hierarchical reports, containing all kinds of filters, aggregates, “drill-through” and “drill-down” detailing and so on, is within the framework of OLAP. This provides full support for multidimensional hierarchical data representation.
Expectations from analytical platforms in a corporate segment
Corporate BI can be called implementations that serve management decisions about the company's key processes, which involve the maximum number of managers at different levels, that is, the serviced process is analyzed at the micro and macro levels - operational and strategic. Only such an approach gives hope for the reliability of data and feedback on corporate reality.
Bottom line: an analytics platform should offer functionality and a template for organizing operational and strategic analytics for both top managers and middle managers. Only a multi-level approach gives a good result and the interest of all participants in the transparency of the process and the high quality of data. Unfortunately, not all vendors understand this aspect of analytics and focus on the emotional part of the software - the visual one. Still, a more useful practice for the company is the harmonious interaction of managers of different levels and joint work on key processes.
