
About the Client
Russian state-owned atomic energy corporation, or Rosatom, combines more than 250 enterprises and scientific institutions, including all civil companies belonging to the Russian atomic energy sector, enterprises belonging to the nuclear arms manufacturing sector, research institutions, and a unique atomic icebreaking ship fleet which is the only one of its kind in the world. Rosatom is the largest power generating company in the Russian Federation: it produces more than 40 percent of all electric energy produced in the European part of the country. Rosatom is the leader on the global nuclear power systems market. It is number one in the world by the number of concurrently constructed nuclear power plants in other countries; it is second in the world by the wealth of uranium deposits, the fifth by uranium production, and the fourth by nuclear energy production. It covers 40 percent of the global demand for uranium enrichment services and 17 percent of global consumption of nuclear fuel.
Challenge
 Rosatom's investment program includes several hundred projects at a dozen branches engaged in coordinated work (nuclear power stations and engineering companies). The processes of planning, monitoring, and analysis of Rosatom's investment program were initially based on the use of Microsoft Office Excel as the main tool. Each branch prepared its requests and reports related to the investment program as MS Excel files, and all such files were processed in the head office. Summary reports were produced after manual checks of compliance and correctness. The flow of reports was growing, and so did the detailed elaboration of the reports and the amount of data. The reports produced by different branches were barely standardized, which resulted in lengthy and laborious processes of reports consolidation. Many indicators in different reports intersected, which required considerable routine work for comparing and checking the data. As the methods used for investment planning were developing, the volume of the summary report grew to exceed the capacity of Microsoft Excel 2007 software, and the number of forms to process surpassed 10,000 per year. In addition, new requirements for prompt generation of analytical notes and reports arose, including the requirement to obtain information snapshot of the investment program instantly, and to have the analytical report generated within 2 hours.
So, a number of critical issues were determined that required an urgent resolution.
First and foremost, there was a need to automate the process of collection and consolidation of reports produced by remote branch offices, and to provide control over the request preparation and request approval.
Second, monitoring of investment program implementation had to be ensured, as the use of Excel files as the main data sources did not provide for comparative analysis of the indicators as required.
Third, the users needed to produce ad-hoc reports for the purposes of monitoring and analysis of the investment program indicators.
Another issue was necessity was to ensure accessibility and consistency of information through building the single information space and providing the single source of information to all users. The system had to operate remotely over an intranet, according to extremely complex security policies.
And last, but not the least, there was an issue with reporting and data consolidation speed.
Solution
![]() Development of the Investment Program Management System (IPMS) was the objective of the project. It had to enable all participants in the program to perform the planning activities and collect performance reports from the remote branch offices, consolidate the data, and perform an extended multidimensional analysis.
Development of the Investment Program Management System (IPMS) was the objective of the project. It had to enable all participants in the program to perform the planning activities and collect performance reports from the remote branch offices, consolidate the data, and perform an extended multidimensional analysis.
The complex security policies existing in the local intranet determined the architecture of the system as a web portal that would ensure maintenance of the common regulatory and reference information (Management of the master data in the framework of MDS Master Data Services), processing the requests and reports coming to the portal as structured Excel files, direct data input from the portal if necessary, control of document flow and compliance with the document flow rules, automatic consolidation, and extended analysis of indicators of the investment program.
The Investment Program Management System (IPMS) includes tools for administration of metadata (forms, reports, the portal) and management of data security policies at the user level and the role level. These tools enable users to develop the system by themselves. Additional services for system adaptation and development by the users were designed, which can be used by the users who are not familiar with the programming and development process.
The requirement for instant analytical data processing and data analysis determined the implementation of the core system based on the OLAP technologies. The leading BI platform Microsoft SQL Server 2008 Analysis Services (SSAS) was chosen for development of the system. All input data was transferred to OLAP cubes. The multidimensional storage became a single source for data storage and retrieval.
The requirement for access to information at all times by all users determined the use of web technologies, particularly, Microsoft Internet Information Services. Thus, the solution ensures constant and reliable scalable access to the information from any location at any time while maintaining the necessary level of security.

Choice of Ranet OLAP
 SSAS server was chosen as the main storage for the system, with access through an Internet portal, as it was necessary to ensure both multidimensional data analysis in the portal and multidimensional data entry mode and data simulation mode.
The dynamic summary table and other visual elements provided by Ranet OLAP were used extensively in the course of design of the user interface of Galaktika BI. Visual elements of Ranet OLAP permit creating dynamic and rich user interfaces. They received very high praise and good feedback from Galaktika BI users, so we decided to use Ranet OLAP for the development of the Investment Program Management System, rather than reinventing the wheel. In addition, Ranet OLAP was the only component available at the time, capable of supporting the modification of multidimensional data in the SSAS using a web browser (the write-back technology).
Benefits of using Ranet OLAP
Visual elements of Ranet OLAP provide the end user with powerful and intuitive analytical tools that meet analytical requirements of the most demanding users and do not require that the user has technical knowledge or skills.
Interactive Designer for Summary Tables
The issue of building arbitrary reports by users is solved by the pivot grid designer in Ranet OLAP. The interactive pivot grid designer allows users to create their custom reports by simply dragging visual elements into special areas. The user who knows all nuances of the investment program planning and monitoring can create more advanced reports. This increases efficiency of the analysis and eventually results in making better-grounded decisions. The user does not need any assistance from the IT department. The option of data export of the report to Microsoft Excel offers additional possibilities for carrying out high-quality analysis.
In addition, all report settings can be saved and easily retrieved from the history later. The settings of summary tables and filters are stored on the server, not on the user's local workstation, therefore they are accessible even when working out of the office. The settings of summary tables and filters can be exported to or imported from XML files. They can be local or global, which is especially helpful, as all users can benefit from the settings of summary tables configured by the most experienced and skillful users or analysts. In other words, there is a transition path from the personal analysis and consumption of information (as, for example, when working with local Microsoft Excel files) to collective analysis and use of information. It adds additional benefits to the business.
Drill Down, Drill Up and Drill Through Support
The users of Investment Program Management System have to process large amounts of information, so it was very important to have services that would simplify their work with data. This is implemented through Drill Down, Drill Up, and Drill Through functions.
- Drill Down enables the user to navigate between various levels of data, from summary level to detailed levels. The hierarchy of the dimension determines the drill down paths, the user can go one level deeper into the data either directly (Drill down) or by expanding the hierarchy level (Expand).
- Drill Up operates in the opposite direction and allows the user to come back from the detailed data to the summary data.
- Drill Through enables the user to see which data was used for indicator calculation. In other words, it permits to switch from the aggregated analysis of indicator values to analysis of individual records from which the indicator value was calculated.
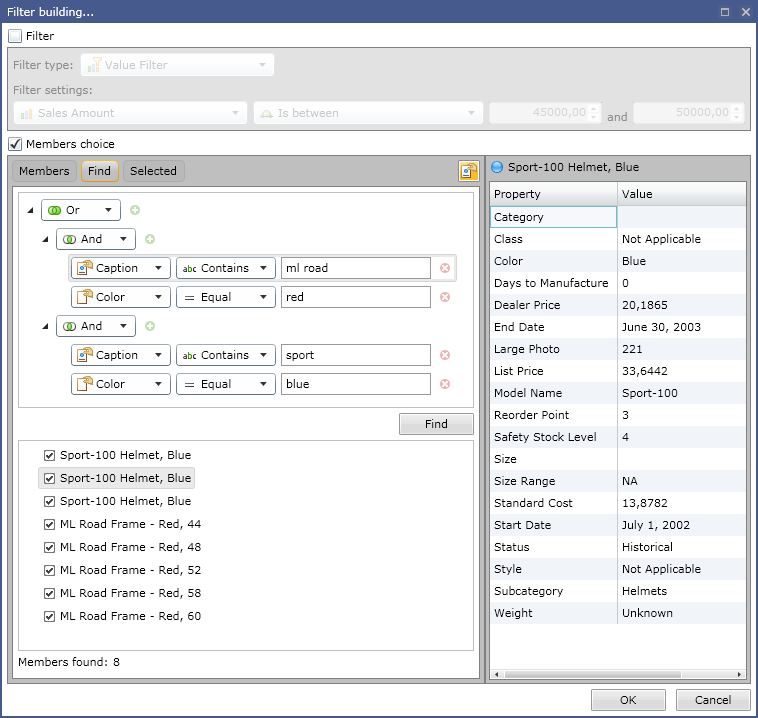
Flexible Search Settings and Filters
Nevertheless, the user often has to search for data or filter data manually. Visual elements of Ranet OLAP have services that simplify this. Filters give access to a search function, where you can define the conditions by specifying the field, the type of check, and the value. Using AND / OR operators, it is possible to define various groups of conditions. Types of check ("Includes", "Equals", "Starts with") and values can be used to specify the search conditions. The list of fields available for search is generated from the list of dimension properties. In is possible to search either the entire dimension hierarchy or the specified hierarchy level.
Display Settings
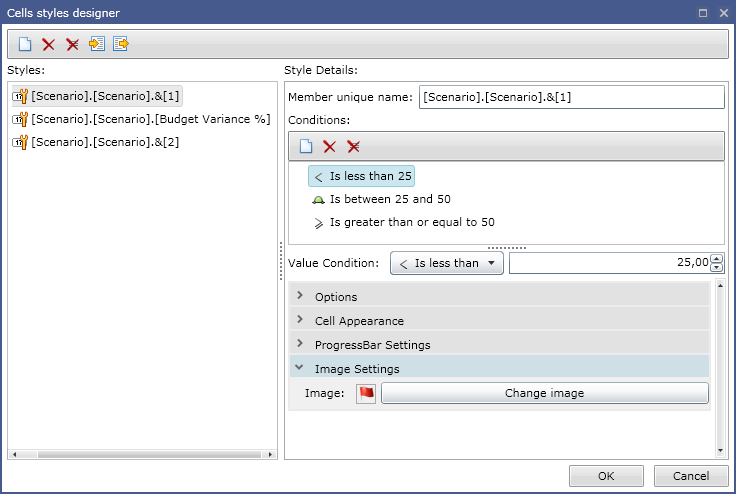
When analyzing investment program indicators, it is often necessary to highlight the cells or ranges of cells of interest, atypical values, etc., with color, font, or icons. It simplifies user's work with data by making it easier to locate certain cells or indicators. Ranet OLAP pivot grid allows conditional display of values based on the cell display formats determined in the cube or in the MDX query (FORMAT_STRING, BACK_COLOR, FORE_COLOR, FONT, etc.). For example, the data imported from reports and the data edited by the user were separated into different elements (members) of the dimension in the cube settings. This allowed highlighting the changes with color, which helped to quickly find the changes in the form.
Nevertheless, the user can open the cell style designer and set the format conditions based on his/her preferences, if necessary. Style settings can be stored on the server and retrieved from the server to reuse as necessary.
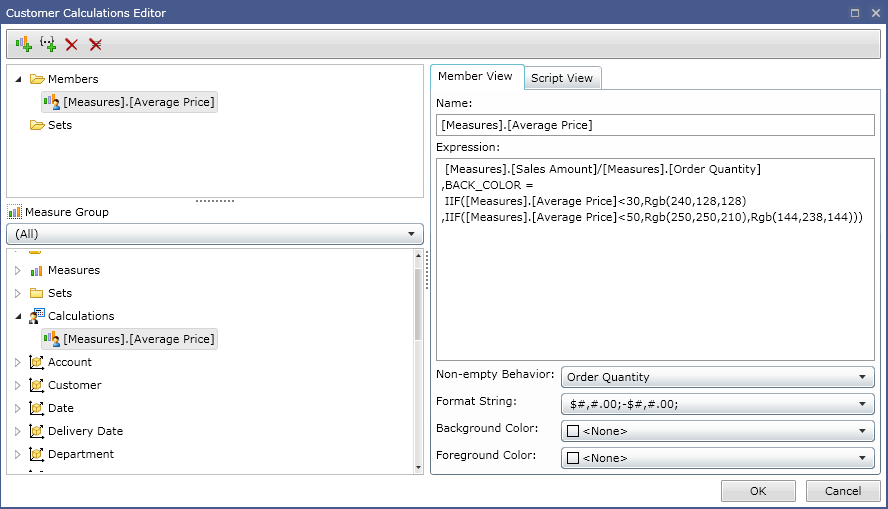
Custom Calculations
In the course of investment program planning, users often have to create indicators and data sets that could not be foreseen at the time of cube setup. These can be calculations for alignment of data for the reports, calculations of models, planning for future periods, etc.
Ranet OLAP pivot grid has a built-in custom calculation editor enabling the user to create his/her own calculated members and calculated data sets. All features provided by MDX language (for example, MDX language functions) are available to the user when creating custom calculations. Creating calculated data sets can substantially simplify reports, as it is possible to create data sets matching the specifics of the report (it can be complex filters or data selection algorithms), save the settings, and use them when designing the report.
It is possible to enable user formats for calculated indicators: displayed value format, background color, font color, etc. There are special convenient forms for setting the format properties.
Editing Data in the Cube (Writeback)
The possibility to edit cube data (the measure groups have a write-back partition) and Ranet OLAP pivot grid were used for direct input of data into the Investment Program Management System by users. Thus, the users were able to introduce the changes directly into the cube, bypassing data import from reports.
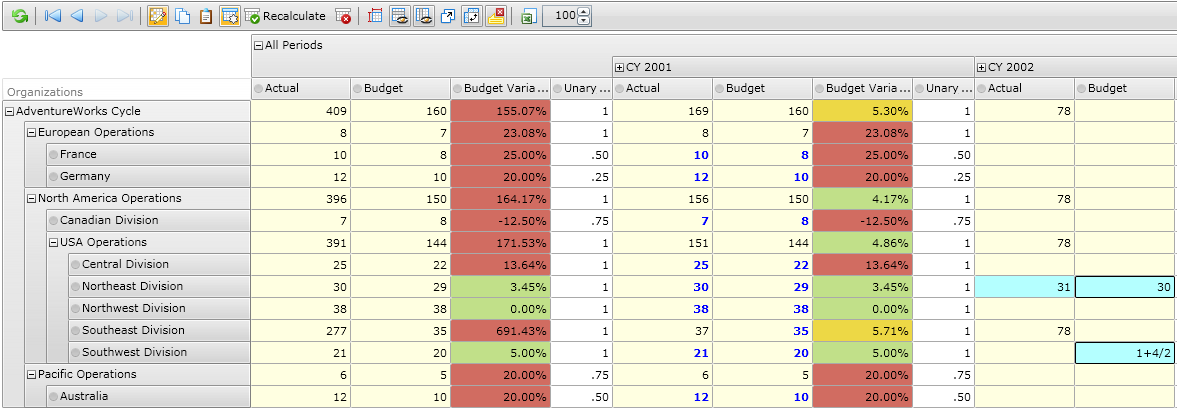
The table area accessible for editing is highlighted with yellow background color. It is determined based on the cube security settings, the indicator type (calculated indicators are not accessible for editing), etc. It is possible to enter an arithmetical expression using the syntax and functions of MDX language into the edited cell. This feature permits calculation of the indicator based on the current context (the server does it in the course of recalculation). The table cells modified by the user are highlighted with background color (blue cell background) and font color (blue color bold text in the cell). Visual rendition of the cell value depends on the mode of data synchronization with the server.
There are two possible modes of synchronizing the changes with the data stored in the server:
- Automatic update: any modification of the cell value results in sending the changes to the server and recalculation of the data. The calculated results are sent back to the client.
- Working with cache memory: the changes are accumulated in the cache memory in the local computer. The changes are sent to the servers as a result of a user's command [Save changes] (Recalculate, Recalculate table data with current changes). This mode decreases traffic and ensures a prompt response.
In so doing, the modified cells that have not been updated in the server are highlighted with blue background color, and the cells updated in the server are displayed with blue bold font. When working with cache memory, the user can send data to the server for recalculation when necessary. In the pivot grid, it is possible to undo the changes that are stored in the cache memory since the last recalculation (save operation) or since the start of editing. In order to cancel the recalculated changes, the user has to undo the entire transaction.
It is possible to enter the data both to list members and to aggregates. When editing aggregates, allocation mechanisms can be applied automatically, depending on the number of subordinated list members.
All changes are isolated within the user session, and they are not accessible by other users until the transaction is fixed.
In order to enable offline work, it is possible to save the result of the initial query and the changes as XML files in the local computer and can be imported from the XML file.
Results
The introduction and use of the system confirmed our correct choice of tools and architecture of the system. Over a number of years of operation of the system, we managed to successfully adapt it to new emerging requirements following the development of the investment planning method and investment monitoring method used in Rosatom, by modifying the system settings only, without reworking the software code. In so doing, the quality of output data was improved, and the cost of preparation and approval of plans and reports were substantially decreased by means of automation of data collection and data verification processes. The essential requirements of the project connected with the speed of workflows were successfully met. With the number of planned and controlled indicators around 300, and the annual number of processed forms around 20,000, the time of collection and consolidation of the reports was shortened to 3 days, and the time of preparation of analytical reports and information sheets was decreased to few minutes.
In addition, the managers were given a personal workplace (the Dashboard) featuring interactive maps for analysis and monitoring of the main indicators of the investment program. Effectively, the manager can perform a quick analysis of the status of the company investment program at any time. It helped to speed up the decision making and improve analysis of complex conditions when there is a deviation.
As the investment program indicator data are stored in the OLAP cube, a number of interactive reports for comparison of the planned and actual indicators, and reports intended for the plan vs. actual analysis of the investment program were designed using the Ranet OLAP pivot grid:
- Report on the use and financing of capital investment and commissioning of fixed assets on account of all sources of finance
- Main indicators of performance of the capital investment plan for the year
- Calculation of the unused limits of financing capital investment
- Report on adherence to the capital investment use time schedule, with breakdown by projects and the structure of capital investment
- Report on adherence to the investment program financing time schedule
- Report on the use of capital investment with breakdown by the structure of capital investment and sources of financing
- Report on the use and financing of the capital investment with the breakdown by projects.
Now the users of the system working in different departments or branch offices can perform comparative cross-analysis of the data concurrently. This would be extremely difficult to achieve using MS Excel. For example, the data supplied by the Monitoring Department arrive monthly as cumulative totals for the month, while the data supplied by the Planning Department are adjusted once in 6 months in the form of monthly increase. The difficult thing is that the employees working in different departments want to see the data concurrently and exactly the same data types as the data were delivered into the system. Comparison forms help in designing the analytical reports in accordance with the client's requirements, with various options.
The comparative data analysis features implemented using the Ranet OLAP functionality provided the main advantage and created a strong alternative to using other tools for these purposes. The data access functionality based on the use of Microsoft Office Excel and the Reporting Services is also integrated into the system as tools for multidimensional data visualization and reporting. However, these tools proved barely usable for complex multidimensional queries and interactive data analysis.
The users of the Investment Program Management System can enter indicator values using the capability of the Ranet OLAP grid table to edit the cube data. The following standardized data entry forms for entering indicators are implemented in the system:
- Use of capital investment
- Increase of non-financial assets
- Commissioning of fixed assets
- Use of sources of finance.
The data entry forms help to decrease human work for preparation of reports, due to the ability to make changes or show the made changes as necessary (for example, if errors, discrepancies were found) etc.
Forms helping to detect errors or discrepancies in the indicators of the investment program were designed using the Ranet OLAP pivot grid, for solving the problems connected with consolidation of the data imported from reports:
- Comparison of advance payments (4 options with different breakdown)
- Comparison of increase of non-financial assets (3 options with different breakdown)
- Planned vs. actual analysis (3 options with different breakdown).
By implementing an investment program management system, the companies can substantially diminish the risks associated with collection and consolidation of reports from remote branch offices, as well as the risks resulting from the static functionality of the reporting and data analysis systems. Actually, the users can setup Excel file templates to be used for import, documents processing procedures, rules for comparison on indicators and error detection.
The functionality of the solution is easily adaptable to the specifics of the company's business processes; it can be easily extended or integrated with the legacy systems or information systems from other vendors.
Conclusion
When choosing the architecture for the Investment Program Management System and when implementing the system, we aimed at creating a prototype solution, so that we could efficiently reuse it for the development of similar type projects connected with consolidated reporting and subsequent analysis of indicators. The practice of implementation of other projects has demonstrated that we made right decisions.
We will continue using Ranet OLAP as the basis for the development of the Investment Program Management System, implementing other planning, budgeting projects, and BI projects, and we highly recommend the use of Ranet OLAP to anyone who is interested in the development of high-quality full-featured information systems or user interfaces.
