
It is often necessary to form a complex report which contains several cycles horizontally.
It should be noted that in such cross reports both the totals for rows and columns must be obtained simultaneously with the calculation of subtotals for groups. Pivot Grid seems to cope with this task. However, it has a drawback. It cannot generate more than one cycle along the axis of rows or columns.
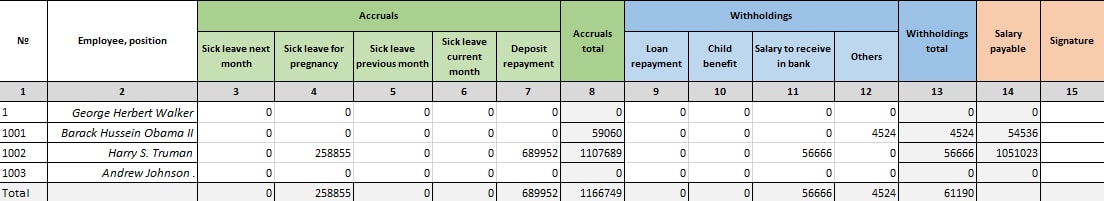
Let’s look at an example of payroll.
The given payroll contains 2 horizontal cycles on accruals and withholdings. They represent two different collections in the code data source (the number of levels may differ in the first and second cycles). In addition, there is a computational column "Payment amount" (Column 14).
Payroll №
It is impossible to generate this kind of pivot grid with the help of XtraPivotGrid.
The following approach is used to develop similar reports (based on FastReport experience). Arrange some PivotGrids horizontally. According to the above-mentioned example:
- 1st PivotGrid contains Columns 1-2, 3-8
- 2st PivotGrid contains Columns 1-2, 9-13
- 3st PivotGrid contains Columns 1-2, 14-15.
- All three pivot grids have the same set of measurements “1” and “2” in the Row area. But they are visible only in the first grid while the second and the third have the width set to zero.
While printing, all three grids are supposed to merge in one visually.
However, if you make such a complex report using XtraReport, unfortunately, you may observe that XtraReport is failed to shift elements on the right of a pivot grid. Consequently, while generating a report each pivot grid expands to the right and as a result, all three grids overlap each other.
This is a sad situation because of a limitation of the current version of XtraReport, 13.2.8. You can vote for ticket Q575588 [if you want this to be improved].
However, in XtraReport there is a feature to programmatically shift on an event the elements located on the right of a pivot grid in XtraReport. It can be done with the help of “BeforePrint” handler for an element on the right of an expanding pivot grid.
Unfortunately, there is another problem. The pivot grid field “RightF” fails to respond the extension. You have to compute the pivot grid width yourself. Remember that the “XtraPivotGrid” is very functional and makes it hard to compute its width.
There has been an attempt to make a correct shift function while the pivot grid expanding which application developers will be able to use multiply in their templates. At present moment Shift2Pivot function given below works correctly for most pivot grid generating cases.
What an application developer of a template report is to do:
- Add Shift2Pivot code to the report script
- For the table on the right, within BeforePrint event do call Shift2Pivot (LeftTable, RightTable) function.
When generating such complex cross reports the height of rows must be controlled not to break the alignment of pivot grids. Therefore WordWrap option for row headings should not be used.
I hope elements will shift themselves in future XtraPivotGrid versions and the above-mentioned trick will be unnecessary.
In case you have other ideas for making such cross reports, please, write to us.
The project with an example can be downloaded at Q575588. The method of shift grid code is written below:
1 2 3 4 5 6 7 8 9 10 11 12 13 14 15 16 17 18 19 20 21 22 23 | /// Shift rightPivotGrid.LeftF on leftPivotGrid.RightF in run-time /// call from BeforePrint method of rightPivotGrid /// /// left PivotGrid /// right PivotGrid private void Shift2Pivot(DevExpress.XtraReports.UI.XRPivotGrid lPivot, DevExpress.XtraReports.UI.XRPivotGrid rPivot) { rPivot.LeftF = lPivot.LeftF + ( // compute the width of row heading area // notice compact row representation ( (lPivot.OptionsView.RowTotalsLocation == DevExpress.XtraPivotGrid.PivotRowTotalsLocation.Tree) // if the row representation is “fold”, add the necessary number of shifts to the width (according to the visible number of columns in the Row area) ? ( lPivot.OptionsView.RowTreeWidth + lPivot.OptionsView.RowTreeOffset * ( lPivot.Fields.OfType().Where(a => ((a.Area == DevExpress.XtraPivotGrid.PivotArea.RowArea) && (a.Visible = true))).Count() - 1) ) //otherwise sum up all the widths of the Row Area. : lPivot.Fields.OfType().Where(a => ((a.Area == DevExpress.XtraPivotGrid.PivotArea.RowArea) && (a.Visible = true))).Sum(a => a.Width) ) // In case of columns in RowArea, add the width of optional data field. + ( ( lPivot.OptionsDataField.Area == DevExpress.XtraPivotGrid.PivotDataArea.RowArea ) ? lPivot.OptionsDataField.RowHeaderWidth : 0 ) // compute the width of Column area // add the down column width multiplied by the number of visible columns // if measures in row or column area is only 1 column, the width is determined by heading. + ( ( (lPivot.OptionsDataField.Area == DevExpress.XtraPivotGrid.PivotDataArea.RowArea) || ( lPivot.Fields.OfType().Where(a => ((a.Area == DevExpress.XtraPivotGrid.PivotArea.DataArea) && (a.Visible = true))).Count() <= 1 ) ) ? // if there is only one measure in data area, the width is determined by headin column are, i.e. down heading width multiplied by number of columns. lPivot.Fields.OfType().Where(a => ((a.Area == DevExpress.XtraPivotGrid.PivotArea.ColumnArea) && (a.Visible = true))).OrderBy(a => a.AreaIndex).Last().Width * lPivot.ColumnCount : // here = [sum of the width of different visible data area columns] * ([number of rows / [number of types of data area columns]) lPivot.Fields.OfType().Where(a => ((a.Area == DevExpress.XtraPivotGrid.PivotArea.DataArea) && (a.Visible = true))).Sum(a => a.Width) * (lPivot.ColumnCount / lPivot.Fields.OfType().Where(a => ((a.Area == DevExpress.XtraPivotGrid.PivotArea.DataArea) && (a.Visible = true))).Count() ) ) ) / 0.96f/*dpi*/; } private void pgRight_BeforePrint(object sender, System.Drawing.Printing.PrintEventArgs e) { Shift2Pivot(pgLeftTable, pgRightTable); |
