Overview
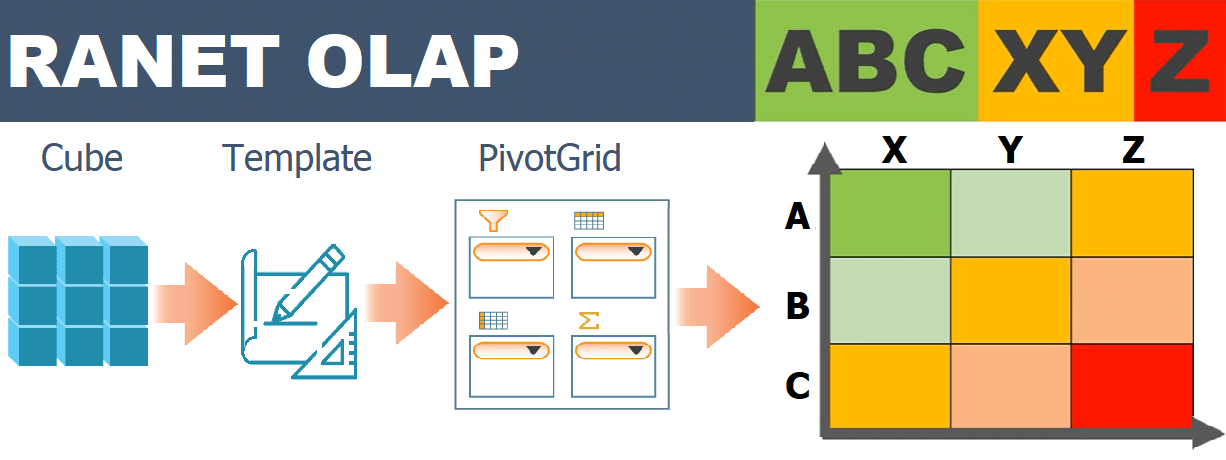
ABC analysis provides a ranking of objects according to their importance in accordance with the Pareto 80/20 principle: 80% of the effect achieved is provided by 20% of the effort. The ABC classification is very useful if you don't have time for deep detailed analysis.
XYZ analysis provides an assessment of the stability of objects over a certain period of time, studies deviations and jumps in indicators. The analysis technique consists in calculating the coefficient of variation for each object and shows the deviation in percent from the average value. The more stable internal business processes are, the more accurately they are predicted.
The analysis period is divided into time intervals. The interval is determined by the level in the hierarchy of the Time dimension of the cube. For example, level: Day, Month, Quarter, etc. Taking into account the selected interval, the number of periods for the formation of a statistical series and the calculation of the coefficient of variation will be obtained.
XYZ analysis implements a strategy based on the evaluation of process stability.
How to set up a template
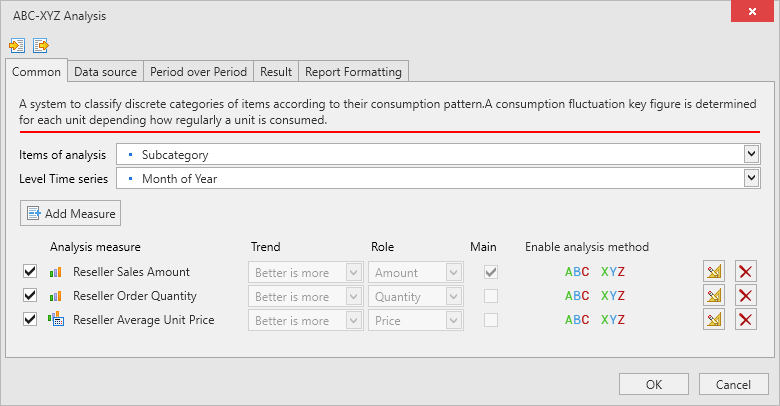
Select the level or hierarchy of the cube as the object of analysis, the level in the Hierarchy of Time to determine the number of periods for which it is carried out (calculation of the coefficient of variation), the analysis measure (classification characteristics) and the parameters of the classification groups.
- Select Object of Analysis
- Select the Time interval into which the analysis period will be divided. This must be a level in the cube's Time dimension hierarchy. Taking into account the settings of the interval and analysis period, the number of periods for which the coefficient of variation will be calculated is determined.
- Click the Add Measure button in the Select Measure dialog box to select a measure from the available measures in the cube measure groups.

- Click the Edit button in the Analysis Measure Settings Editor dialog box to configure:
- In the General settings category: Set the relevant flag if the indicator is Basic;
- In the settings category ABC Analysis Strategy, configure the parameters of the classification groups;
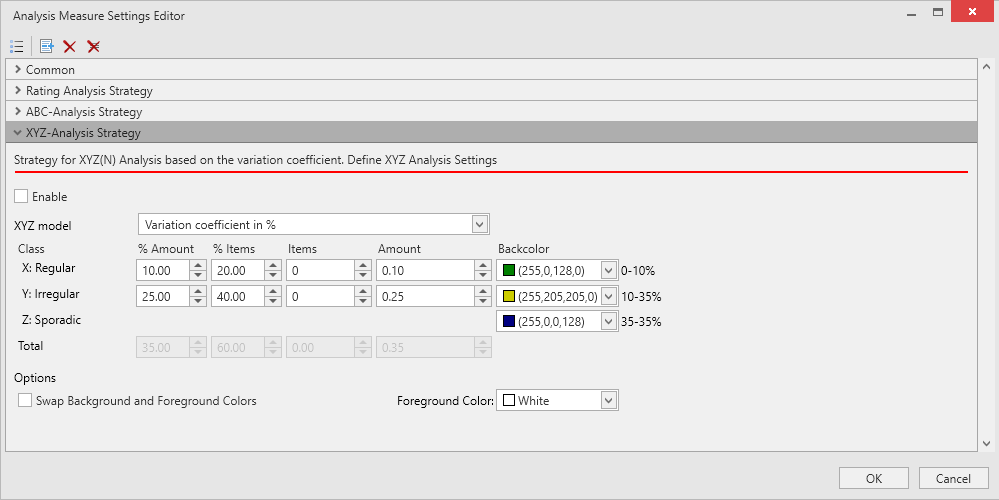
- In the settings category XYZ Analysis Strategy:
- Select XYZ Analysis Method;
- Adjust the XYZ classification group boundaries according to the selected method;
- Customize colors to highlight cell backgrounds for XYZ classification group values;
- If you want to swap the background color settings with the font color, set the relevant flag.
- By analogy, add other indicators to the template, if necessary
- Set up the rules for generating the initial data set for analysis.
- Set up the rules for generating the resulting data set.
- Set up rules for formatting cells in the pivot table in the report.
Next steps
Save template settings for reuse.
The report template is configured. Click the OK button to generate the report.
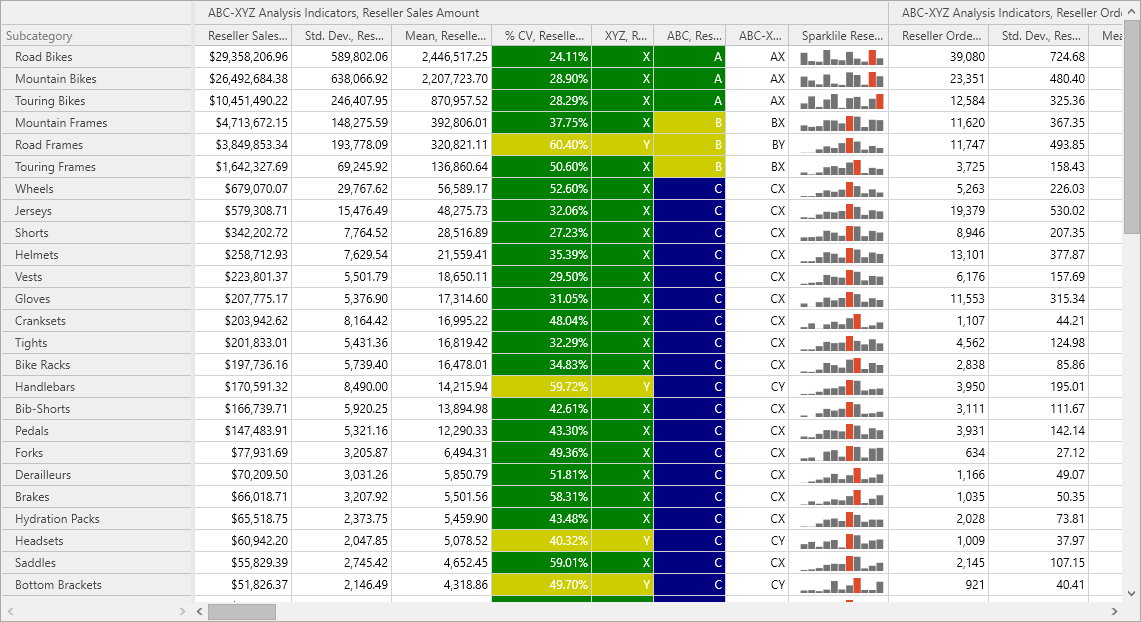
An example of a report in a pivot table for an integrated ABC/XYZ analysis generated by a template is presented below.