
- What Is a Pivot Table?
- The Pivot Structure
- Hierarchical Data Display
- Aggregate Functions and Positions
- Filtering and Displaying Top Values
- Sorting and Scrolling
- Range Grouping for Customizable Level of Detail
- Easy End-Under Configuration via Fields List and Field Zones
- Export to Microsoft Excel
- Integrating Ranet OLAP PivotTable in ASP.NET Application
What Is a Pivot Table?
A pivot table is a tool providing an opportunity to view data in several dimensions. Although Microsoft Excel allows generating pivot tables there is often too much data to be presented and analyzed hence Excel is not a perfect match here. Anyway generating simple and dynamic pivot tables can appear to be quite a challenging task. That is why we would love to devote this article to a very useful and user-friendly tool intended to create pivot tables - ASP.NET Pivot Table - built-in our BI application Ranet OLAP.
Pivot tables, or crosstabs, suit for aggregated data visualization. In contrast to usual data grids which represent tabular datasets pivot table rows and columns are computed dynamically by organizing the data input and table results and values such as average, count, sum, etc.
Most commonly end-users need to export a set of data from business transactional applications and create pivot tables on their own with Excel. Ranet OLAP offers a solution through which it is possible to create and customize complex reports in a matter of minutes.
Although the pivot table control seems to be complicated to work with it is one of the most mighty and flexible when it comes to data management. It is a brilliant solution to conveniently arrange, compile, and analyze accumulated and fresh information. ASP.NET pivot table enables end-users to detect market trends and fluctuations influencing an organization’s performance. OLAP pivot grid suggests comparing data, automatic figuring and statistics computing. All in all, it greatly contributes to gaining significant business insights.
The Pivot Structure
A usual pivot table is composed of three dimensions. The x-axis constituted the headings at the top of the pivot table. As for y-axis, it constituted the left column of the table. The z-axis is in its turn accountable for the values matching both y-axis and x-axis.
A simple pivot table is composed of only one z-axis column for each x-axis value whereas a sophisticated pivot table has several z-axis columns for x-axis value.
It is essential that the z-axis values are numeric due to the fact that the z-axis values are compiled vertically and horizontally. If z-axis is non-numeric it will generate an exception.
Hierarchical Data Display
Thanks to Ranet OLAP pivot table end-users are enabled to select the details which they want to analyze the data with. It is possible to sort and group column and row fields so that to be able to extend and wind down the parent group in order to attain the required data granularity level.
Aggregate Functions and Positions
With a pivot table, it is possible to promptly pick and alter aggregate functions exploited for the data analysis. End-users may choose from sum, count, average, max, min, etc. There is as well an opportunity to choose from more complex functions such as variance, product, deviation, etc. Moreover, it is also possible to alter column and row totals’ position: bottom/top, left/right. A good news here is that all that can be accomplished pretty easily: a line of code and several mouse clicks apply the control according to the needs.
Filtering and Displaying Top Values
A single property can be used to enable filtering of the OLAP data. It is possible to filter by value or label or to exploit the report filter and hide certain fields in the report. This way, for example, the value filter ‘Top’ lets a user see the utmost values and focus on the information which appears to be the most crucial.
Sorting and Scrolling
Sorting. A pivot table embedded in the Ranet OLAP solution provides an opportunity to harness a sorting function. It enables end-users to sort the data compiled in rows and columns by ascending or descending it.
Scrolling. If a pivot grid demonstrates more data than the amount matching the page design it is possible to scroll it with frozen rows in the heading of the table. This function doesn’t affect the performance or speed of the program.
Range Grouping for Customizable Level of Detail
In case the report shows the data by day but the end-user needs to see the data for a month or more range grouping is available. Commonly the control is accessible in several variants: numeric, date, and custom. This implies that it is possible to pick numeric ranges, time intervals, and customize the implementation on-demand.
Easy End-Under Configuration via Fields List and Field Zones
Due to a pivot table, data can be viewed from different angles through sorting, filtering, showing and hiding pieces of data. One is able to alter the column, row, and filter fields. To do this the end-users can use:
- Drag-and-drop operation between various field zones.
- Context menus on the field zones.
- Field list allowing to append new fields to the report.
Export to Microsoft Excel
The main feature of the pivot table is that the users can export reports to Excel. All the content of the table of a current page may be exported and shared among teammates and colleagues.
Integrating Ranet OLAP PivotTable in ASP.NET Application
A lot of Ranet users need to integrate the pivot table into their ready applications, so when we developed it we tried to design the architecture that would allow developers to rewrite and add functionality to the solution according to their business needs implying ASP.NET pivot table. Still, certain issues may arise during the integration process. Thus, in this chapter we describe the very process of the integration of Ranet Pivot Table into an ASP.NET application.
First, let’s create an ASP.NET project in Visual Studio. We used Visual Studio 2013 for this example, but the process will be just the same if you work in Visual Studio 2015. Besides, in VS 2015 you can develop the backend using ASP.NET Core, which will let you create a cross-platform solution that can be hosted not only on Internet Information Services.
We added Web API to the project, so all data in the project is transferred from the server through Web API.

Then, download Ranet Pivot Table for HTML. This is a complete solution for analytical reports that is ready for deployment on IIS. It is also deployed on our demo server: https://bi.galaktika-soft.com/js/RanetOlap/

After you’ve unzipped the files you need to rename the bin catalog to dll, and then copy the catalog in the web application’s directory (except the Global.asax file). Then add Assets folder and index.html file to the project.
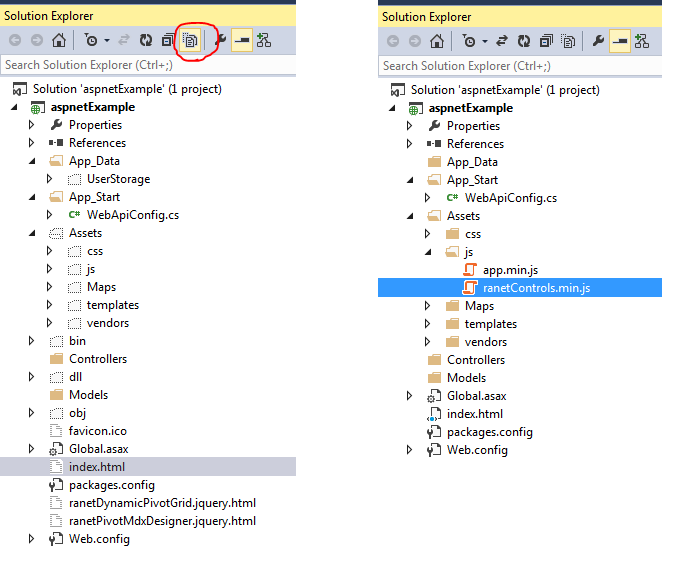
Now, add to the project a reference to Ranet.Analytics.PivotGrid.dll from the dll catalog.

Now you can compile and run the project. If you’ve done everything correctly, you should see a web application similar to the app deployed on our demo server. The best way to make sure everything is correct is to check the database connection.

If you see such pop-up window, you’ve done everything correctly. In this case, you can rewrite the functionality we have included in Ranet ASP.NET Pivot Table the way you need. Users usually have various business needs they customize the component to – some need tо store the reports in the database (SQL Server, MySQL, PostgreSQL) rather than the file storage, others – to be able to filter the metadata tree the end users use to create reports, manage the view etc.
We hope this article will be helpful for you. Don’t hesitate to contact us in case you have any questions about Ranet ASP.NET Pivot Table for HTML5.
