
Interactive reporting is one of the most important tools of modern business intelligence. Currently, business analysts of companies widely use so-called Pivot Tables. With the help of a special Pivot Table, users can quickly build all kinds of analytical reports and predictive business scenarios. However, in real life, there are often situations when an end user who needs to get some kind of analytical report cannot do without the help of a developer or business analyst who can code complex business data interpretation algorithms. To empower all business users, without exception, we have included ready-made Report Templates for analytical reporting in our Ranet OLAP product. Ready-made Templates implement the most popular analysis methods, such as:
- ABC analysis
- XYZ analysis
- ABC/XYZ analysis
- Comparative analysis and analysis of options
- Analysis based on objective ratings
- Analysis based on Pivot Tables
Let's take a look at what the Template is, using the example of ABC analysis.
The template is implemented as a Designer, which is used to configure all the key entities of the report. The user selects the Object of Analysis, Dimension, Hierarchy Level and adds the measures he wants to include in the report for analysis. Measures can be added as many as needed without restrictions. In addition, the user can configure additional fields for each measure, for example: more-less, roles, and so on. After that, the rules for obtaining data are configured: these are all elements of the hierarchy, or leaf elements, or only selected elements. Optionally, you can also exclude selected items. Then the user can customize how the result will look. After that, the Template can be saved for its reuse. The report based on the Template is generated in the form familiar to the user - in the form of user calculations.
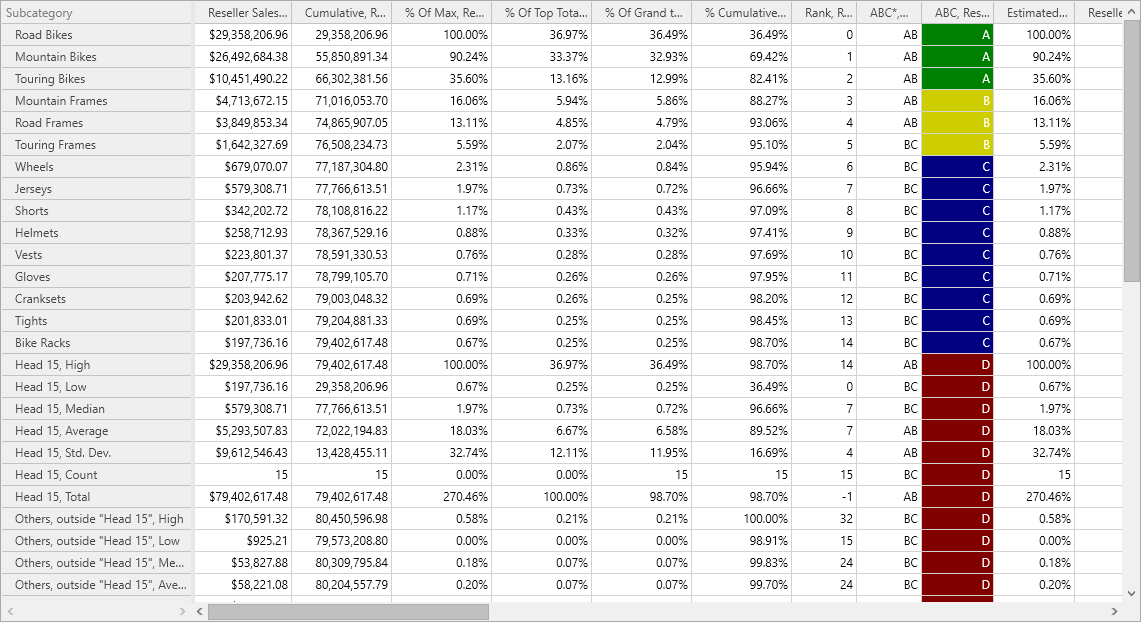
Image 1 shows the ABC analysis report by subcategories. In the Report Designer, all custom calculations are formed in a visual form for the user to make it convenient to work with them.
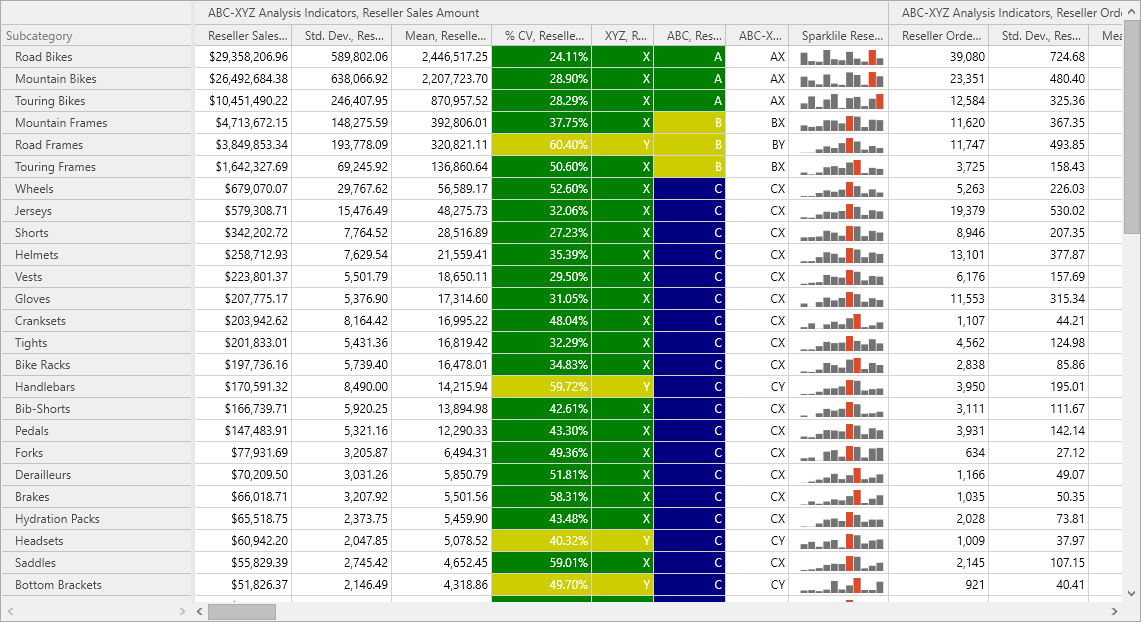
Image 2 shows an analysis report based on the ABC-XYZ analysis template. Here comes an element that is related to the measurement of time, since the XYZ analysis is related to the analysis of the stability of various processes. For example, you can analyze the time period Year by month, you can set up comparison of periods, the function of working with parallel periods, etc. All interactive reports from Ranet OLAP are easily exported to Excel, where the user can continue to work with them.
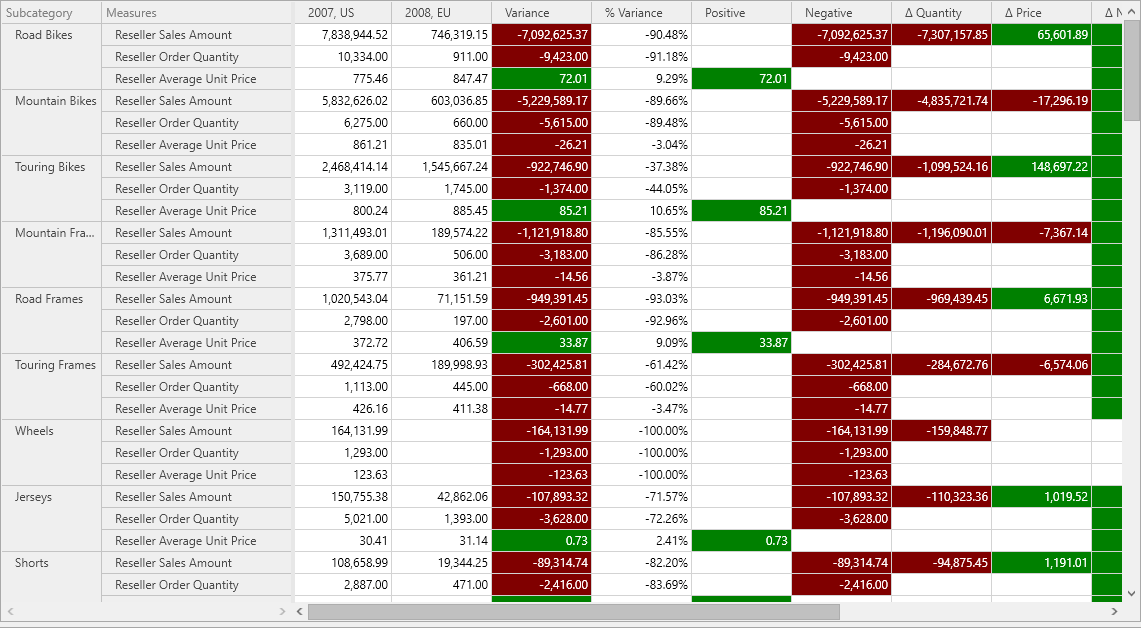
Image 3 shows a report based on comparison analysis. Comparison analysis is a very important element in the business data analysis process. However, it is usually difficult for an ordinary user to implement the comparison analysis algorithm itself, since first it is necessary to correctly describe the comparison criteria, and then correctly implement them in an MDX query. With the help of the Designer in Ranet OLAP, this task is simply solved in seconds.
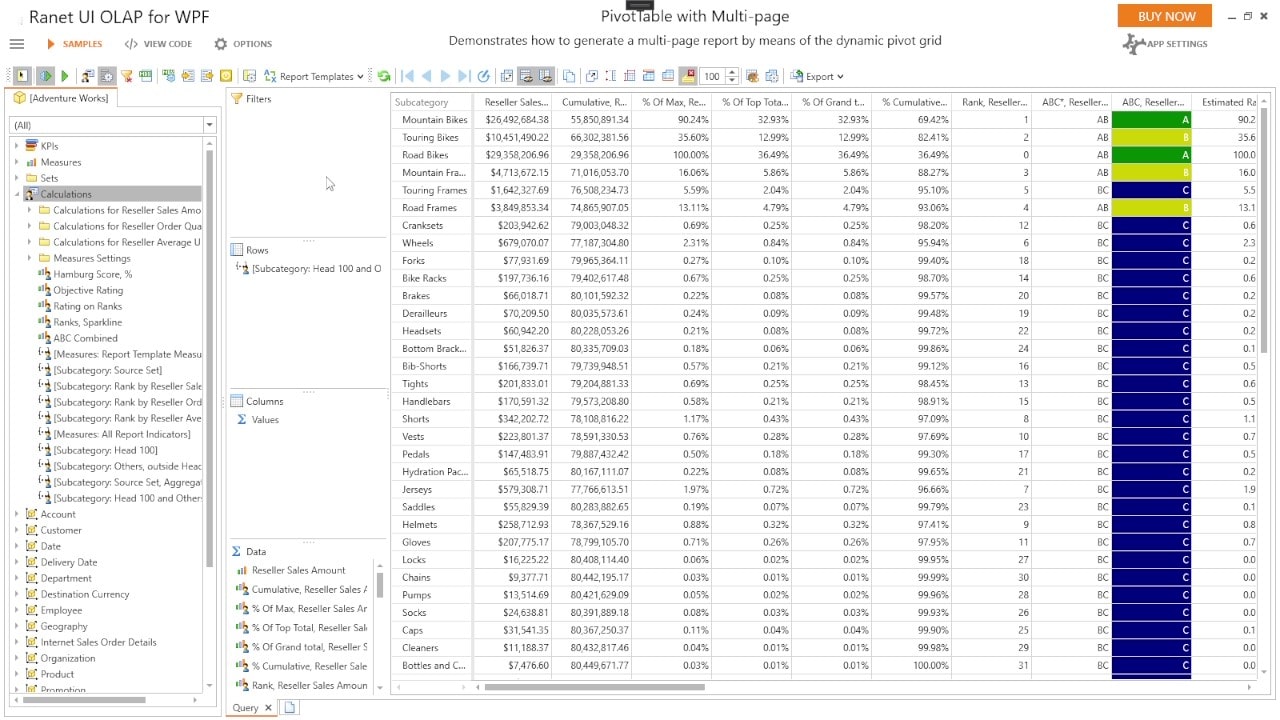
Objective rating analysis (Image 4) – algorithms for calculating integral ratings are implemented, somewhat “reminiscent” of XYZ-analysis. The algorithms implement the so-called Hamburg Score. The algorithm itself is already written in Ranet OLAP and can be independently viewed and adjusted in Custom Calculations: rules for generating an estimated rating, Hamburg Score, an objective rating already taking into account the weights of indicators, a “heat” map, etc.
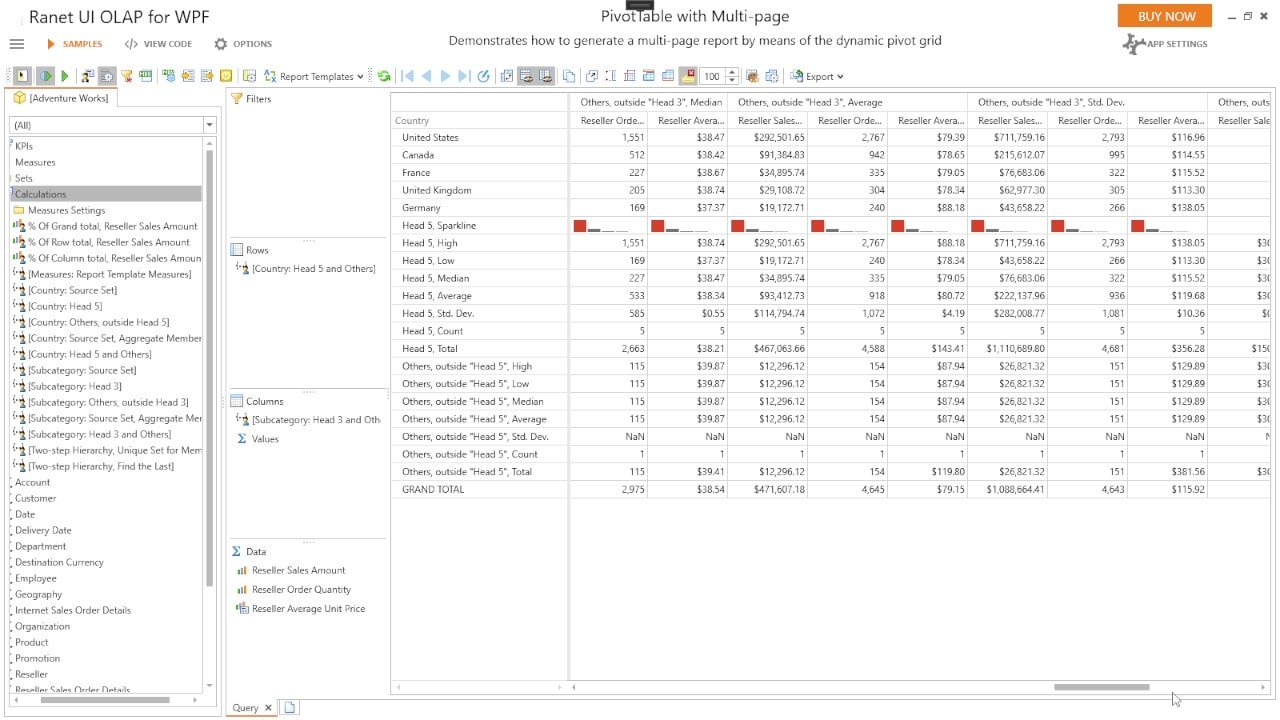
Cross Tables (Image 5) use a similar mechanism, as in the Pivot Table familiar to the user, with the ability to configure aggregates by sets for rows and columns. In addition, Sparklines have also been introduced here for quick visual perception of the report data by the user.
Watch our video for a more detailed introduction to ready-made analytical reporting templates in Ranet OLAP.
