

OLAP technology is distinguished by its ability to process datasets quickly even when they are huge as all public libraries in your country combined. It is possible in large part due to a specific OLAP data structure as a cube. Basic OLAP system architecture consists of:
- OLAP dimensions;
- measures and its groups;
- partitions;
- perspectives;
- hierarchies;
- actions;
- KPIs;
- calculations;
- translations.
Today we’ll take a closer look at OLAP dimensions and measures and figure out what they are and how they impact on the way the information is processed.
What Are Dimensions in OLAP
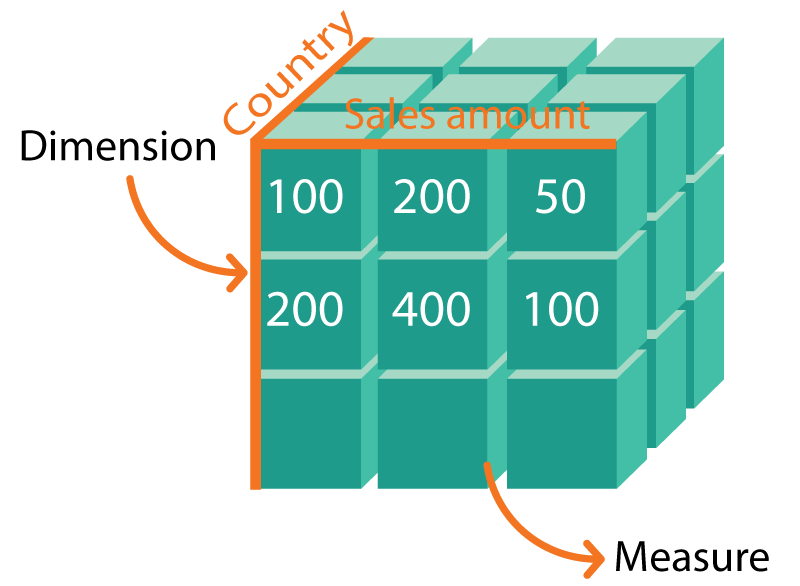
The main difference between an OLAP dimension and an OLAP measure is that the first one forms the data structure, and the second one is responsible for providing users with numeric values used when creating reports.
But let’s figure out what is a dimension in OLAP first. An OLAP dimension takes the highest level in the OLAP datacube structure. We can define OLAP dimension as the metadata element, which describes the core economic indicators of enterprise’s activity, for example, products, customers, sales region, and period of time etc. OLAP dimensions help in data grouping and filtering on various grounds. Then this information can be detailed into other hierarchies, and that is how you can obtain an in-depth business data analysis. For example, an OLAP dimension ‘Country’ is detailed to “Region”, then - to “Town” etc.
How does it work in practice? Imagine that your co-worker or boss needs a simple summary of graphic cards sales for 2017. Due to OLAP application, an analyst can detail the report and obtain the information for the more narrow duration of sales. Also, it can be useful to know how the beginning of sales of new cheap and revolutionary powerful model affects the sales of traditional graphic cards by well-known brands. Thanks to this information the analyst can track market trends promptly and correct the company’s business development strategy if needed.
Precisely dimensions, interacting with measures, make it possible to create necessary planar and voluminous data slices in reporting. While using Ranet OLAP, you can also make a graphic chart. Like report creation, it will take a few minutes.
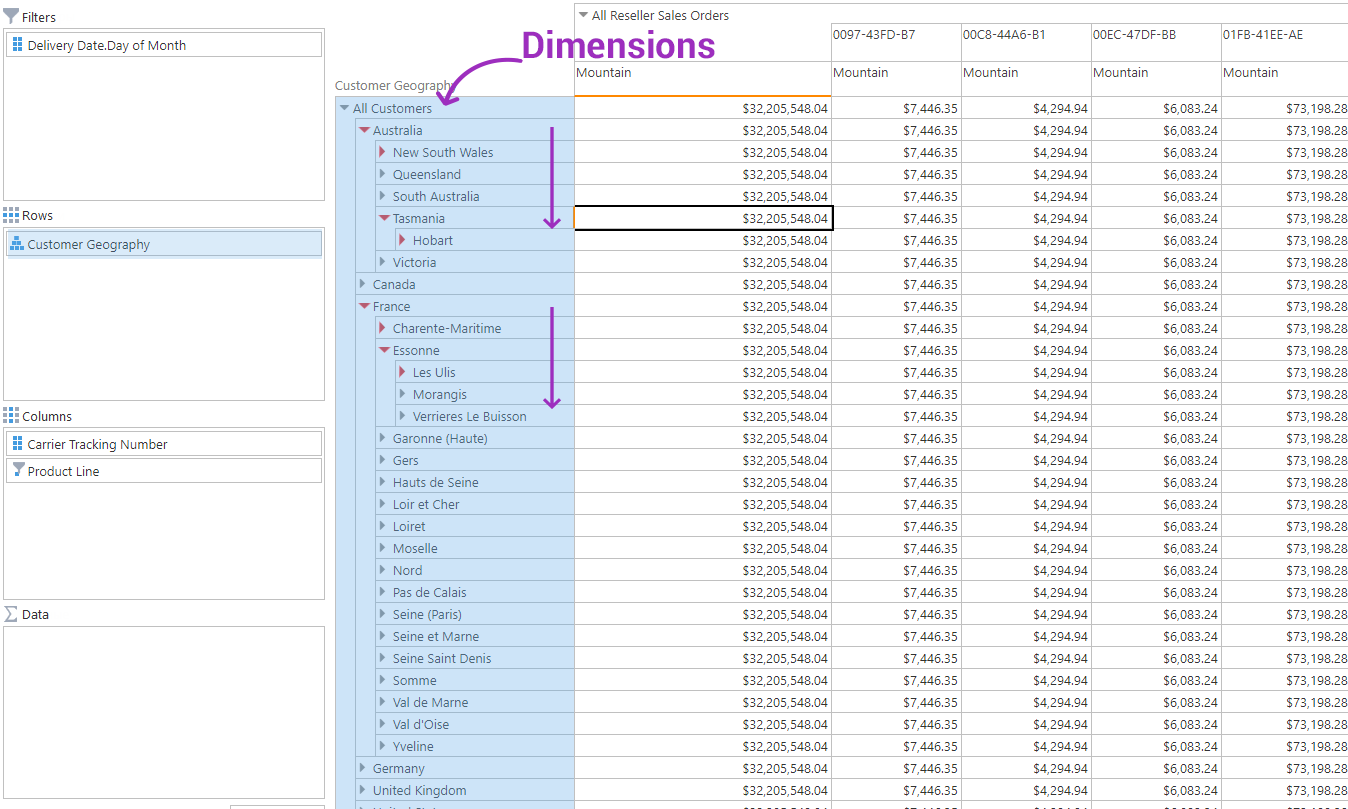
All dimensions in Ranet OLAP are displayed in alphabetical order in Metadata Tree. To view all dimension hierarchies a user should click left mouse button on the icon of the required element.
Do you know, that up to 94% of manually created reports contain numeric and factual mistakes? You can avoid inaccuracies in reports just by starting using Ranet OLAP. It not only helps in making excellent reports but also enables you to spend less time on routing actions.
What Are Measures in OLAP
By definition, each cube must have at least one measure. In practice, one cube contains several, sometimes even hundreds of measures.
Let’s start here with OLAP measure definition. In comparison to dimensions, measures don’t submit to hierarchies. Most often, OLAP measure meaning is a numeric value by which the dimension is detailed or aggregated. It specifies a certain OLAP dimension and answers the “How much…?” question. For example, information about totaled bike sales is set out in one of the measures.
Namely, the measure is what BI apps users are mostly looking for because numeric values form the basis of reports. The absence of hierarchies doesn’t prevent quick values calculations. You can use aggregation and granularity options, such as Sum, Min, Max, Count etc.
For making more complex calculations you can use MDX query builder. It is a set of OLAP measure expressions, which helps create a compound formula for obtaining analytical data. MDX in Ranet OLAP works in two modes: the first is for users with no technical background, the second is for advanced users, for instance, programmers. One more useful tool is OLAP measure filter. Active filters in the top left corner allow to choose required data for particular query.
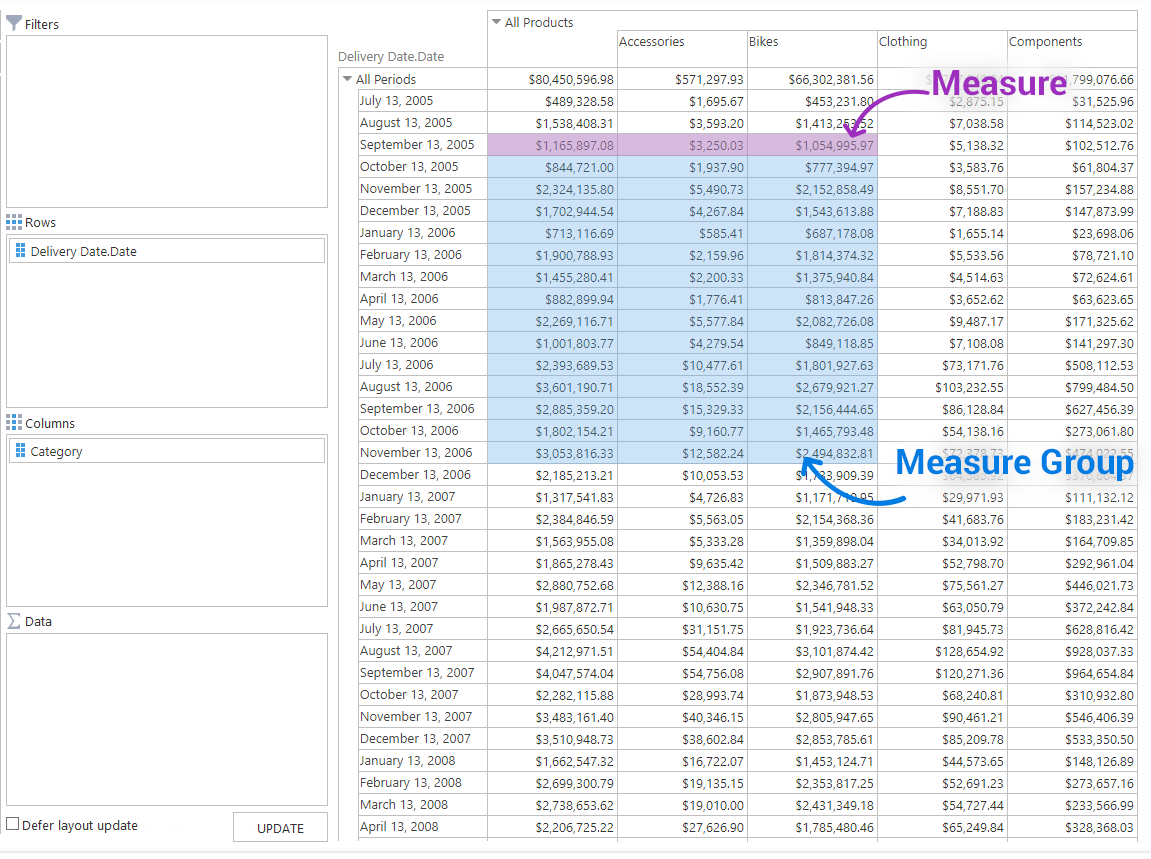
Measure Groups
Measures in the cube are clustered according to basic fact tables. In other words, facts contain numeric values for data warehouse, and measure groups contain measures for OLAP cube in the same way. Measure groups can be arranged in the following ways:
- Measures of the same granularity level are grouped into one set.
- Measures from one fact table can be qualified as a measure group.
- In certain contexts measures can proceed from several fact tables.
A measure group has a list of partitions, which contain isolated sets of information, and aggregations. An aggregation is a ready-to-use dataset. In this case, values have been previously calculated for each of the measure groups. It is done to increase queries execution productivity. Measure grouping itself helps rationalize processing of users’ queries.
Measure Group as an object contains the following information: the name of the group, storage mode, and processing mode.
Follow the link and begin your introduction to manipulating the cube data using Adventure Works demo databases.
