
Comparison and analysis of deviations help to identify inclinations or trends in relation to some of the organization's business processes. For example, by comparing current month's sales with previous monthly sales, you can identify specific markets or items that need attention and take smart steps to improve sales and overall organizational performance.
Overview
Comparative analysis provides a comparison of homogeneous objects with each other according to various criteria. Traditionally, we compare the actual value of an indicator with its target value in its absolute or relative terms.
For each object of comparison and analysis, two values of the evaluation criterion are compared - the Indicator, one of which is selected as the target value - Base, and the other as the actual value - Slice.
Comparison of indicator values is carried out according to the rule: Slice minus Base.
Quick start
Select a cube level or hierarchy as an object for comparison and analysis, define measures and comparison criteria.
If the template indicators include sum, quantity, and price, you can assign the appropriate roles for them. In this case, the Price Volume Analysis (PVM) will be included in the report template. Analysis of price-volume differences improves the quality of the analysis by showing how changes in volume or price in the product mix have affected the difference between actual and target values.
The setting is described below.
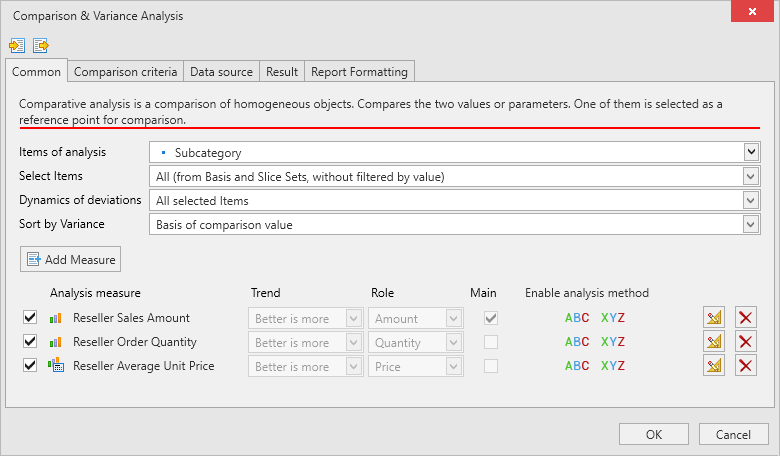
Common settings
Object of analysis
Select the Object of Analysis.
Select elements
The setting determines which result set will be generated based on the comparison of two sets of Base and Slice.
The result set is the set of analysis elements that will be displayed by default in the report generated by the template.
| Settings | Target |
| All (from Base and Slice sets, no filter by value) | Combining elements from sets for Base and Slice |
| Constants (available in Base and Slice sets: <> 0 for Base and <> 0 for Slice) | Selecting elements that are both in the Base set and in the Slice set |
| New (available in the Slice set, but not in the Base set: 0 for Base and <> 0 for Slice) | Selecting elements that are only in the Slice set |
| Lost (available in the Base set, but not in the Slice set: <> 0 for Base and = 0 for Slice) | Selecting elements that are only in the Base set |
This way, you analyze changes in the structure of groups for comparison.
Dynamics of deviations
The setting defines a filter for the result set by the value of the deviation of the Base (reference point) and Slice indicators.
Are the results favorable or unfavorable? The Favorable/Unfavorable Outcome Report also considers how a favorable or unfavorable position affects the business. The variance is shown as positive if income are above the budget. If spending is over budget, the variance will reflect an unfavorable indicator.
| Target | |
| All Filtered Items | No filter, all items are displayed |
| Negative ((Slice - Base) < 0) | The indicator at the reference point was better than the comparable one. The Items with deviation sum < 0 are displayed |
| Positive ((Slice - Base) > 0) | The compared indicator exceeds the indicator at the reference point. The Items with deviation sum > 0 are displayed |
This way you analyze negative and positive trends.
Sort by deviation
The setting determines by the value of which indicator the result set will be sorted.
| Settings | Target |
| Comparison Base | Sorting by indicator value Base |
| Comparison Slice | Sorting by indicator value Slice |
| Absolute Deviation (Slice - Base) | Sorting by absolute deviation of Base and Slice indicators |
| % Deviation (Slice - Base) | Sorting by relative deviation of Base and Slice indicators |
Indicators
Define indicators for comparison and analysis.
Comparison criteria
Define the comparison criteria to be applied for each object of comparison and analysis, and each indicator included in the template. Based on the evaluation criteria settings for the Base and Slice Comparison hierarchies, unique elements - tuples - are formed. The current analysis element and indicator (measure) are added to each of the tuples. Thus, the coordinates of the cells in the cube are determined, which are to be compared.
As a result, two sets of homogeneous data will be formed. One set for the Base settings, and the other for the Slice settings. These sets, in turn, will be combined into a set for comparison and analysis.
Comparison is carried out by direct comparison of the values of indicators for the base Slice and the Slice for comparison: What (base Slice) and What (comparison Slice) are compared with.
To determine the dynamics of an indicator, add the Time dimension to the criteria.
| Settings | Target |
| Criteria | Hierarchy or its level in the cube dimension, the elements of which will act as one of the comparison criteria. |
| Comparison Base | Elements that will be taken as the Base for one of the comparison criteria. Determined by selection. |
| Comparison Slice | Elements that will be taken as a Slice for one of the comparison criteria. Determined by selection. |
| Aliased name (pseudonym) | A unique name for the Base and Slice criteria sets that will be used when generating custom calculation names and will inform the user about the criteria assignment. If the name is not specified, then it will be programmatically rendered. |
If no elements are selected for the criterion, then the element of the highest level in the hierarchy will be taken as an element for comparison.
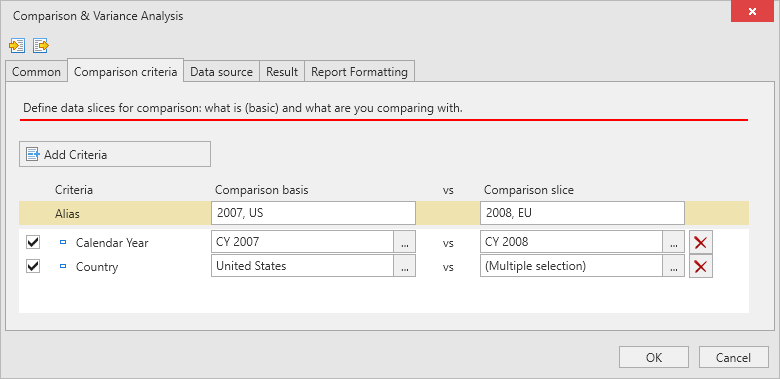
Add Criteria
Add criteria for comparison.
Delete criteria
Remove hierarchy (level) from analysis criteria.
At least one criterion for comparison must be defined in the template settings.
Data source
Set up the rules for generating the initial data set for analysis.
Result
Set up the rules for generating the resulting data set.
Report Formatting
Set up rules for formatting cells in a pivot table report.
Next steps
Save template settings for reuse.
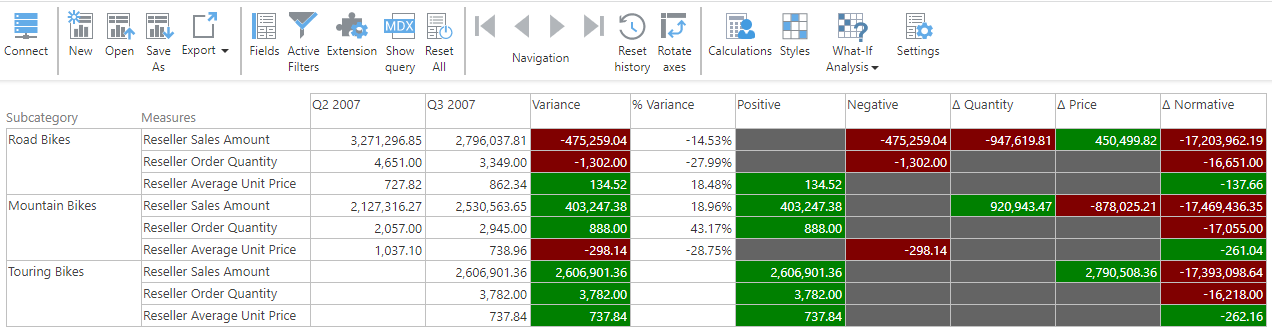
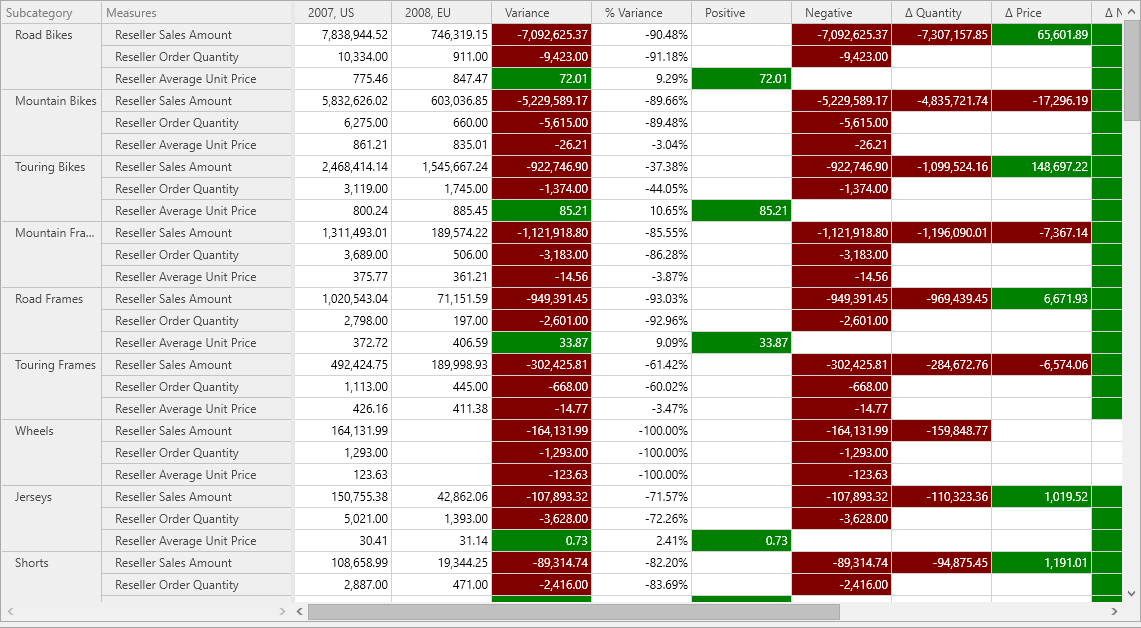
The example of a report in a pivot table for comparison and analysis of deviations, generated according to a template, is presented below.
Also:
