Ranet OLAP visual controls offer strong functionality and excellent design. This intuitive and easy-to-master tool does not require technical knowledge or programming skills from the user. It can meet business analysis requirements of the most demanding users.
Unlimited analytical possibilities offered by Ranet OLAP controls enable the user to view the data from various angles. They help reveal business development trends that could have gone unnoticed or seemed of no importance.
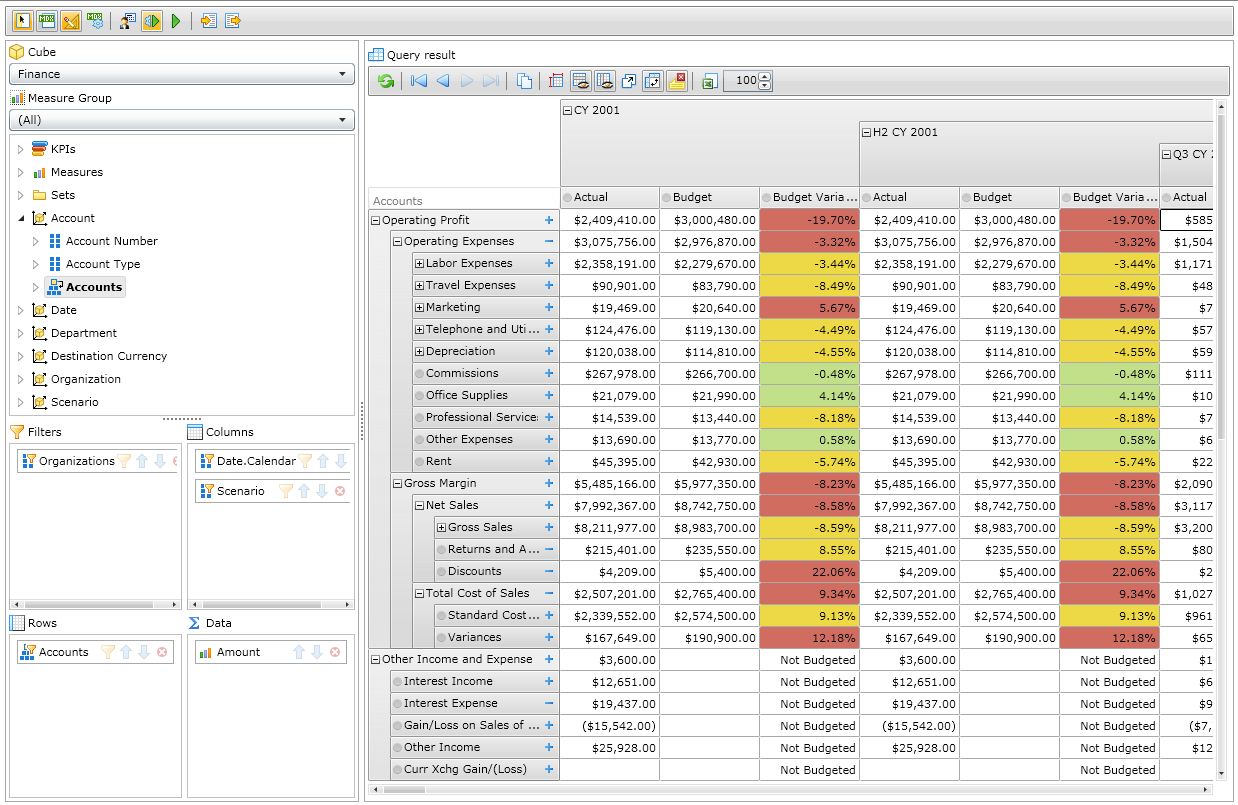
The visual controls in Ranet OLAP library help to create interactive reports of any complexity based on the data in the Microsoft Analysis Services OLAP cubes. Depending on the skills and professional level of the user, one can build an interactive report simply by dragging and dropping the cube metadata elements to the filter area, rows, columns of the summary table. Alternatively, it is possible to prepare a complex MDX query, using maximum capabilities of the MDX language, in order to achieve the most efficient solution for the report.

The Drill Down, Drill Up, and Drill Through functions give the user the maximum possibilities for detailed data analysis:
- Going into different data levels, from summary to detailed data (the hierarchy of the dimension determines the drill down ways);
- Possibility to go down to the detailed data (Drill Down) by expanding the hierarchy nodes or going back to the summary data (Drill Up);
- Analyzing the actual data behind the aggregate indicator (Drill Through);
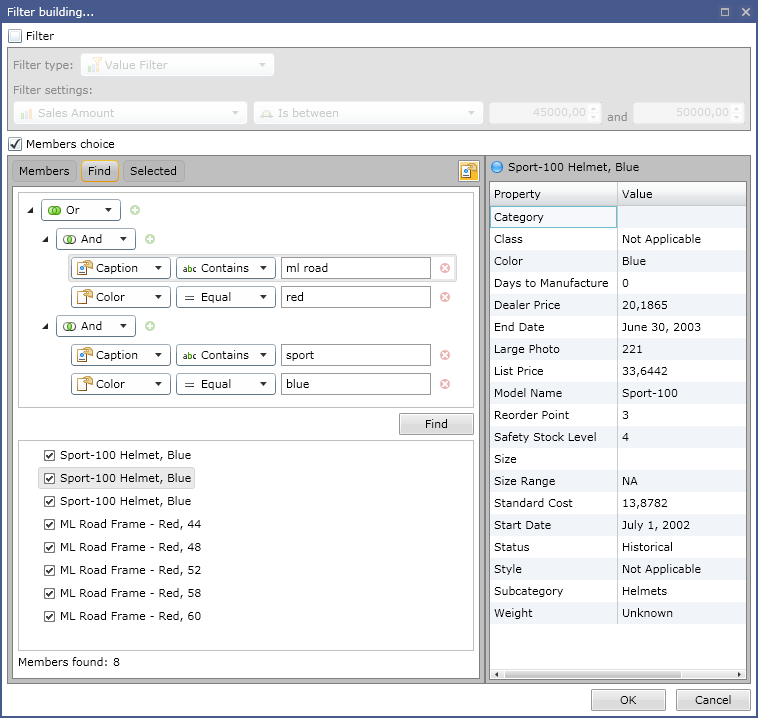
Flexible filter configuration parameters permit data search and data filtering based on most diverse criteria. It is possible to combine criteria using AND and OR operators, various types of tests (like "contains", "equal to", "starts with") and measure or property values help to specify the search request.

It is possible to save the configuration of reports and filters on the server rather than on the local user machine, to make them accessible from any non-office location at any time. It is possible to export or import the configurations from/to XML files, which is important as many users can use summary table configurations prepared by the experienced and skilled people. In other words, there is a path from personal use and analysis of information (as, for example, working with Microsoft Excel files) to shared use and analysis. And this promises additional business benefits.
The function of data export to Microsoft Excel format offers additional possibilities of qualitative analysis, including off-line analysis.
Access to the data in the summary table can be arranged based on access rights in the SQL Server Analysis Services. This would ensure high-security level when working with data, based on the role of the user.
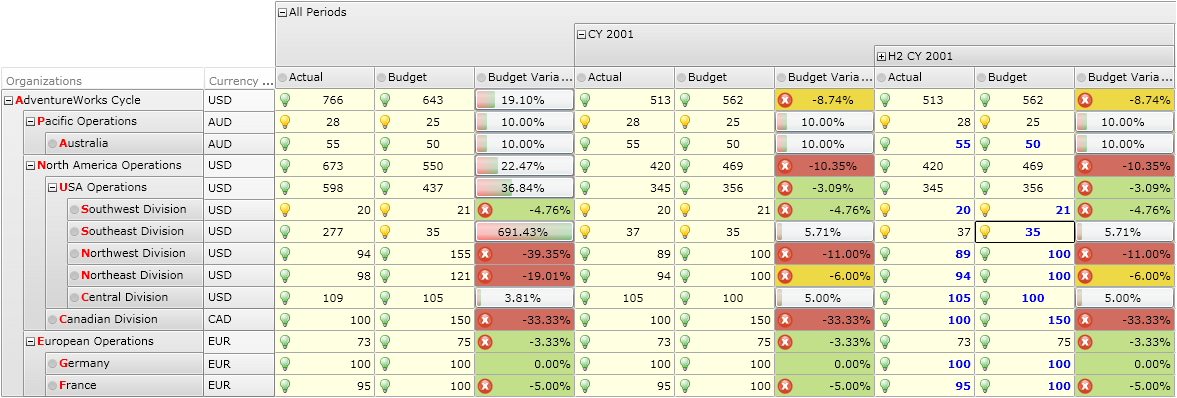
Features of the library provide good usability, ergonomic design and comfort in the reports: cell formatting based on the cube format settings (BackColor, ForeColor, etc.) and custom format settings, conditional font and image parameters depending on the cell values, the possibility to hide empty rows or columns, flip (rotate) axes, scale the tables, navigation through historical data.

Ranet OLAP includes visual components for building and processing MDX queries, delivering the query results to the client, and showing them in the summary table and in other visual elements. Learn more from Ranet OLAP Visual Controls List.
Text is available under the Creative Commons Attribution-ShareAlike License; additional terms may apply.

