

BI technologies have been used by businesses for decades. Today, however, with the development of cloud technology, BigData and machine learning, BI is moving to a new level.
Whether we like it or not, that’s the real fact. The digital transformation of the enterprise is directly based on data. Those who can use new technologies to receive and use information, quickly create and launch new business models will survive. Those who cannot - will die out as a result of natural selection.
That is why following current trends is so important. What are BI trends in 2019? Find it out in our article.
Few words about BI history
We have already touch BI topic in our articles Data visualization in business intelligence and Business intelligence implementation. But as you can see, this topic can be discussed endlessly.
You can be surprised but BI roots originate long before modern computing technologies occurrence. The earliest BI mention dates back to 1865, when Richard Davens used the term Business Intelligence to describe the actions of Henry Farness, who studied the data, analyzed market conditions and thereby outpaced his competitors. Today, the market has more than 50 different products that offer BI functionality to one degree or another. But what were the steps that brought us to it? Let’s see in more detail.
| Decision Support Systems | Appeared in the 1970s after Edgar Codd presented a new method of data organization. Relational databases allowed us to make a breakthrough in the field of BI and decision support tools actively developed until the mid-1980s. |
| BigData and Consolidation | Active consolidation of data in the 1980s began to accumulate in single centers, creating the conditions for in-depth and comprehensive analysis. BI tools gained access to large amounts of data, but remained sophisticated technical tools, so without a professional IT person it was impossible to build another report, and therefore the business did not use this category of solutions so often. |
| Business interest | In the 1990s, BI technologies began to be seen as a business tool, and it found its application in many industries: from mining to production and finance. At that time, BI solutions were very expensive, and the task setting could take several days. |
| Real time solutions | In the 2000s, a technological base appeared for real-time data processing, which means that companies were able to make decisions instantly, based on current, constantly changing information. Various dashboards began to appear on the market, displaying a set of indicators, as well as BI systems with an intuitive interface, in which business users could make requests. |
| Cloud technologies | In 2019, users prefer to work with BI on a subscription basis. A cloud-based approach eliminates the risk of payback problems, as well as try a new product using test licenses. BI system developers also support Trial schemes, as they increase the potential for subsequent license purchases even by small companies that would not have previously decided to use BI in their practice. |
Business intelligence market trends
So what new trends in business intelligence should we follow? Here are top 7 latest trends in business intelligence:
1. Augmented analytics
Augmented analytics is the next wave of breakthroughs in the data processing and analytics market. It uses machine learning and artificial intelligence technologies to transform the development, consumption, and sharing of analytic content.
By 2020, augmented analytics will be the main engine of new purchases in analytics and BI, as well as Data Science, ML platforms and embedded analytics. Leaders in data processing and analytics are required to plan for the implementation of augmented analytics as the platform develops.
2. Continuous intelligence

By 2022, more than half of the new large business systems will use continuous intelligence, which in turn uses real-time contextual data to improve solutions.
Continuous intelligence is a design pattern in which real-time analytics integrates into business operations, processing current and historical data to propose actions in response to an event. It provides automation or decision support. Continuous Intelligence uses several technologies, such as
- augmented analytics,
- event flow processing,
- optimization,
- business rule management,
- machine learning
3. Augmented Data Management

This technology uses ML capabilities and AI mechanisms to create categories of company information management, including data quality, metadata management, master data management, their integration, as well as self-tuning of database management systems (DBMS). It automates many tasks and allows less skilled users to use the data themselves. In this way, highly qualified technicians can focus on more important tasks.
Augmented data management converts metadata from those used only for audit and reporting, ultimately supplying them to dynamic systems. Metadata changes from passive to active and becomes the main engine for all AI / ML.
By the end of 2022, the number of tasks performed manually in the field of data management will decrease by 45% due to the introduction of machine learning and automated service level management.
4. Natural language

Obviously, it is not very convenient for users to make requests in some specific format, as well as to decrypt the answers received in the form of some calculations. It would be much easier to ask: “How are our sales going, Cap?”, And in response receive: “Sales have grown by 18%, it is necessary to buy more eggplants.” In order to embody this approach, today developers are actively introducing technologies for working with natural language - NLP (Natural Language Processing) and NLG (Natural Language Generation). To implement the approach, we use the achievements in the field of artificial intelligence, which are specially trained to convert linguistic structures into computer queries and vice versa. Thus, the accuracy of NLP and NLG is growing every day.
5. AI

AI models are most often used to improve or completely replace a person in decision-making. However, in some scenarios, companies need to justify how these models come to specific decisions. To build user or stakeholder confidence, application architects must make these models more simple and understandable.
Unfortunately, most advanced AI models are complex black boxes that cannot explain how they came up with a specific recommendation or solution. Explained AI in data science and ML platforms, for example, automatically generates an explanation of models in terms of accuracy, attributes, statistics of models and functions in a natural language.
6. Blockchain

The main value of the blockchain and distributed ledger technologies is to provide decentralized trust in a network of untrusted participants. There is a significant potential for options using analytics, especially those that involve the relationships and interactions of participants.
However, it will be several years before four or five core blockchain technologies begin to dominate. Until this time, the end users of technologies will be forced to adapt to the technologies and standards of the blockchain, which are dictated by the prevailing customers or networks. This includes integration with existing data infrastructure and analytics. Integration costs can exceed any potential benefits. The blockchain is a data source, not a database, and does not replace existing data management technologies.
7. Graphics
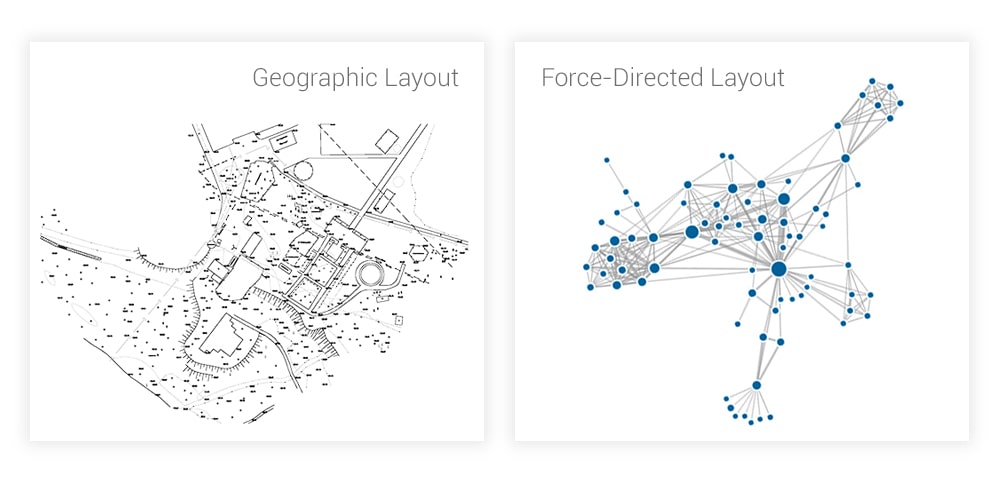
Graph analytics is a set of analytical methods that allow you to explore the relationships between objects of interest, such as organizations, people, and transactions.
The use of graphical processing and graphical DBMSs will increase by 100% every year until 2022, which will accelerate data preparation and provide more complex and adaptive data science.
Graphic data warehouses can efficiently model, explore, and query data with complex relationships between data warehouses, but the need for specialized skills to work with them is their main limitation today.
Graphical analytics will grow steadily over the next few years, as there is a need to ask complex questions to complex data, which is not always practical or at least feasible on a scale where SQL queries can be used.
FAQ
Drawing a line we want to give you even more useful info. So as usual we will answer top asked questions about business intelligence statistics and future of BI tools.
What else will wait us in the world of BI?
Here are some other recent trends in business analytics that will be relevant in 2019 and 2020:
| Conversational Analytics | By 2020, 50 percent of analytic queries will be generated using search, natural language processing (NLP) or voice, or automatically. The need to analyze complex combinations of data and make analytics available to everyone in the organization will lead to its wider use, which will allow analytics tools to be as light as a search interface or a conversation with a virtual assistant. |
| Data fabric | The data fabric provides unhindered access to and sharing of data in a distributed data environment. It is a single and consistent data management framework that provides unhindered access to data and the possibility of architectural processing in any other storage. Until 2022, custom data fabric designs will be deployed primarily as a static infrastructure, forcing organizations to invest in a new wave of costs for a complete reorganization to provide more dynamic approaches to the data mesh. |
| Storytelling | Provides the ability to tell a visual story to demonstrate the analysis (and the recommendations for action found by the system). In addition to existing visualization methods, storytelling opens up the possibility of effective communication with those people who were not deeply immersed in the problems or business processes of the department. Some dashboards today offer storytelling opportunities. For example, Domo’s BI solution allows you to create a story to demonstrate any of the insights found in the analysis process. |
What BI tools will be relevant in 2019 and 2020?
Of course, it is all depends on your requirements and company’s size. However, those 4 tools are more universal and relevant:
- DOMO: a business management cloud package that integrates with multiple data sources, including spreadsheets, databases, social networks, and any existing cloud or on-premises software solution. It is suitable for companies of any size, from small to large, compatible with Windows or Mac platforms, iPad tablets, and also works on mobile devices.
- Sisense: a business intelligence class solution that simplifies the analysis of complex data by offering an end-to-end solution for combining and visualizing Big Data and arbitrary disparate data arrays. Sisense supports the full BI cycle, from data collection and preparation to comprehensive analysis and visualization with extensive functional development and management
- Ranet OLAP: a ready-to-use solution for business data analysis. Ranet OLAP provides components for reporting, forecasting and analyzing the data from different perspectives. These OLAP tools provide end-users with wide options for ad-hoc data analysis and reporting. You also can try it for free as Ranet OLAP offers demo and free 30-day trial.
- QlickView: a self-service business intelligence platform for all corporate business users. Using it, you can analyze data and use the results to support solutions. QlikView program gives you the opportunity to ask yourself questions and answer them, to independently follow the path of knowledge.
